Objective of Elastiflow with VMware SD-WAN by Velocloud – Part 1
VMware SD-WAN (Velocloud) supports exports flow information in Netflow IPFIX format to one or more Netflow collectors, this is documented in “Configured Netflow Settings”.
A Netflow collector supporting IPFIX in theory is able to display flows from Velocloud Edge. However, the Velocloud Edge flow has specific information such as “vcFlowPath” to describe the flow is going direct, going via Gateway, going via Hub Edge, etc. That means how much specific information to Velocloud is able to display in the Netflow collector is another story.
As of the time of written this post, I am aware of two commercial products, which are VMware vRealize Network Insight and Plixer Scrutinizer both officially claims to support VMware SD-WAN by Velocloud.
Elastiflow (https://github.com/robcowart/elastiflow) caught my attention as it has added support of Velocloud since version 4.0.0 (https://github.com/robcowart/elastiflow/releases). More importantly, Elastiflow is free to use as per my understanding. As a result, I would love to have the Elastiflow up and running as a collector/analyzer for Velocloud in my lab. Then I can see the capabilities of Elastiflow when working with Velocloud.
In this “Part 1”, the target is to document the steps for installation of the Elastiflow to a stage that flows from Velocloud Edge are visible in Elastiflow. The capabilities, limitations, hints of integrating Elastiflow with Velocloud are targeted at “Part 2” (hopefully can get time to do that).
Elastiflow with Velocloud Topology
The following is the topology (Figure 1) for this post:
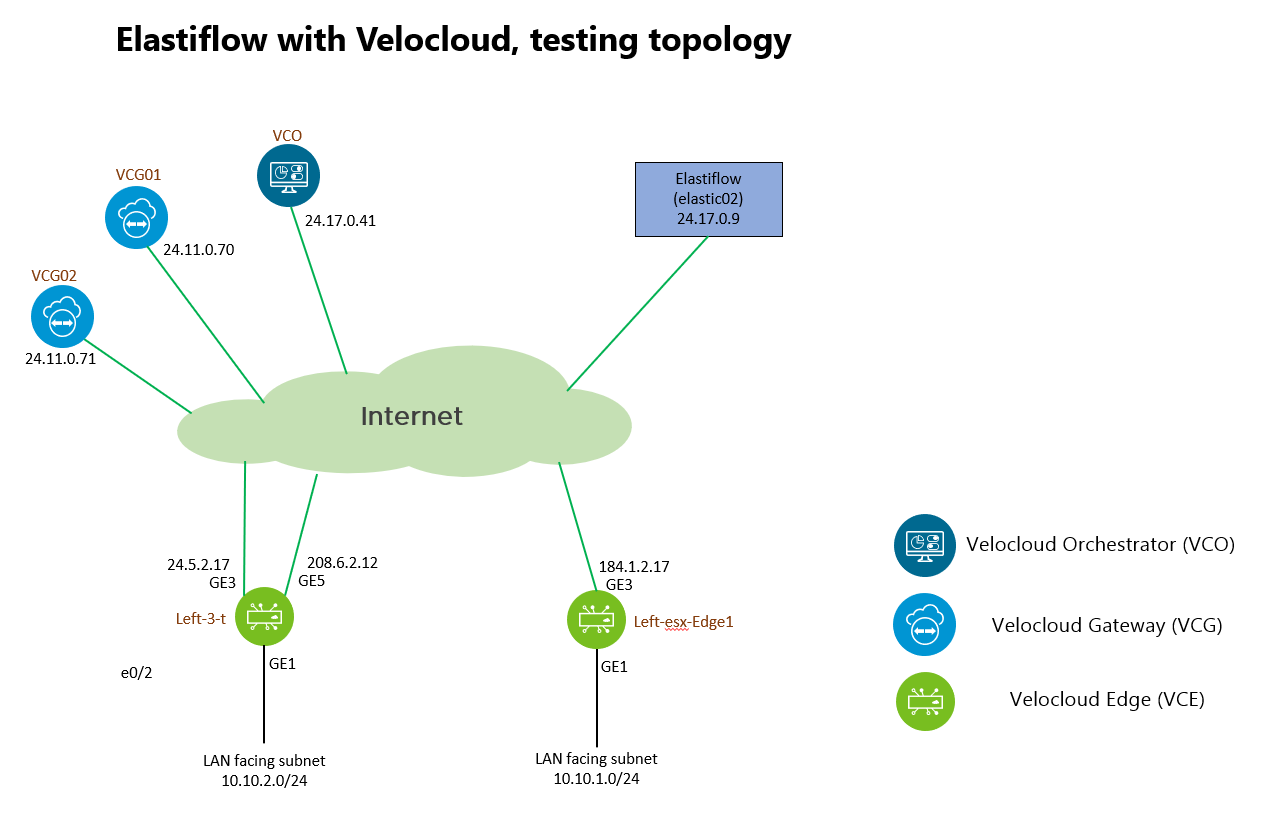
The setup is a dark site (closed environment) which everything is simulated. The are two Velocloud Edges (VCE) and the focus is on the VCE with name Left-3-t which will be the one sending IPFIX to the ElastiFlow virtual machine (elastic02).
Version Information
VMware SD-WAN, Velocloud:
The VCE is this test is running version 3.4.3
Elastiflow:
The VM responsible for Elastiflow is an Ubuntu 20.04 server with 4 x vCPU, 32G RAM, 250G storage. Elastiflow version is 4.0.1.
Elastiflow Installation and Configuration
The official procedure can be found here: https://github.com/robcowart/elastiflow/blob/master/INSTALL.md
Let’s break down to the way how I get the installation done:
Note: In this post, root user is being used for running the commands in the Ubuntu Linux. This is a bad habit, do not treat that as a usual practice, using non-root user with sudo is recommended.
Some preparations on the Linux
The Ubuntu Linux is named as elastic02, with static IP address 24.17.0.9
Installing net-tool and unzip
This will make “ifconfig” and “unzip” commands available for later use.
root@elastic02:/home/leejoe# apt install net-tools unzipAdjust net.core.rmem_default and net.core.rmem_max
Since the IPFIX, Netflow are UDP packets, Elastiflow needs to increase the receive buffer size. Add the following two lines to /etc/sysctl.conf
net.core.rmem_default = 33554432net.core.rmem_max = 33554432
The following figure shows the grep command output after the changes of /etc/sysctl.conf

To make the change effective immediately, issue the following commands:
root@elastic02:/home/leejoe# sysctl -w net.core.rmem_default=33554432
net.core.rmem_default = 33554432
root@elastic02:/home/leejoe# sysctl -w net.core.rmem_max=33554432
net.core.rmem_max = 33554432
root@elastic02:/home/leejoe#
Installing Java
Java is required by Logstash. Issue the follow command to install Java
root@elastic02:/home/leejoe# apt install default-jreAfter the installation of Java is completed, verify the installation by “java -version”
root@elastic02:/home/leejoe# java -version
openjdk version "11.0.8" 2020-07-14
OpenJDK Runtime Environment (build 11.0.8+10-post-Ubuntu-0ubuntu120.04)
OpenJDK 64-Bit Server VM (build 11.0.8+10-post-Ubuntu-0ubuntu120.04, mixed mode, sharing)
root@elastic02:/home/leejoe#
Disable the firewall
Since the purpose is to have a test environment to test the Elastiflow, disabling the firewall to avoid the firewall is blocking the ports needed for Netflow.
root@elastic02:/home/leejoe# ufw disable
Firewall stopped and disabled on system startup
root@elastic02:/home/leejoe#
Elastic Stack Installation
Installation of Elasticsearch
Firstly, import the Elasticsearch PGP Key by:
root@elastic02:/home/leejoe# wget -qO - https://artifacts.elastic.co/GPG-KEY-elasticsearch | sudo apt-key add -
OK
root@elastic02:/home/leejoe#
Next, install the apt-transport-https
root@elastic02:/home/leejoe# apt install apt-transport-httpsThe 3rd step is to save the elastic-7.x repository definition
root@elastic02:/home/leejoe# echo "deb https://artifacts.elastic.co/packages/7.x/apt stable main" | sudo tee /etc/apt/sources.list.d/elastic-7.x.list
deb https://artifacts.elastic.co/packages/7.x/apt stable main
root@elastic02:/home/leejoe#
Before the installation of Elastisearch, it is necessary to perform “apt update”:
root@elastic02:/home/leejoe# apt updateLastly, install Elasticsearch
root@elastic02:/home/leejoe# apt install elasticsearchConfiguration of Elasticsearch
The configuration file of Elasticsearch is /etc/elasticsearch.yml
The following are the changes I have made:
- Change the “network.host” line from
#network.host: 192.168.0.1
Tonetwork.host: 0.0.0.0 - Change “cluster.initial_master_nodes” line from
#cluster.initial_master_nodes: ["node-1", "node-2"]
Tocluster.initial_master_nodes: ["24.17.0.9"] - Adding the following two lines to /etc/elasticsearch.yml
indices.query.bool.max_clause_count: 8192
search.max_buckets: 250000
The first change of network.host will make Elasticsearch listen on all IP addresses of the host. This change is not a must (probably not a good practice for production), I make this change which will let me check the Elasticsearch status over the network.
The second change of the cluster.initial_mask_nodes is to let the Elasticsearch aware there is only a single member in this configuration. You need to change the IP address to the corresponding IP address of your virtual machine.
The third changes of configuring the values of indices.query.bool.max_clause_count and search.max_buckets are the requirement of Elastiflow.
The following screen capture shows the output of the corresponding parameters in elasticsearch.yml after the above changes:

Starting Elasticsearch and verification
Start Elasticsearch service by “service elasticsearch start”
root@elastic02:/etc/elasticsearch# service elasticsearch startCheck the Elasticsearch service is running or not by “service elasticsearch status“

While confirmed the elasticsearch service is running, can point the browser to localhost:9200 to further check:
root@elastic02:/etc/elasticsearch# curl http://localhost:9200
{
"name" : "elastic02",
"cluster_name" : "elasticsearch",
"cluster_uuid" : "IDMLMAzwQZWUZhJIO5aMxg",
"version" : {
"number" : "7.9.2",
"build_flavor" : "default",
"build_type" : "deb",
"build_hash" : "d34da0ea4a966c4e49417f2da2f244e3e97b4e6e",
"build_date" : "2020-09-23T00:45:33.626720Z",
"build_snapshot" : false,
"lucene_version" : "8.6.2",
"minimum_wire_compatibility_version" : "6.8.0",
"minimum_index_compatibility_version" : "6.0.0-beta1"
},
"tagline" : "You Know, for Search"
}
root@elastic02:/etc/elasticsearch#
Getting an output similar to above means the elasticsearch service is running properly.
Installation of Kibana
Since I am going to have a single Ubuntu hosting all three Elasticsearch, Kibana and Logstash, and Elasticsearch is already installed, at this stage, can go ahead to use apt to install Kibana:
root@elastic02:/home/leejoe# apt install kibanaConfiguration of Kibana
The configuration file of Kibana is /etc/kibana/kibana.yml
Two changes will be make in kibana.yml
- Uncomment the line server.port: 5601
- Change the “server.host” line from
#server.host: "localhost"
Toserver.host: "0.0.0.0"
The first change let Kibana to listen on the default port number 5601. The second change makes Kibana listening on all the IP addresses of the Ubuntu instead of just localhost, this allows visit the Kibana page over network.
The following screen capture shows the output of the corresponding parameters in kibana.yml after the above changes:

Check the Kibana service status by “service kibana status“:
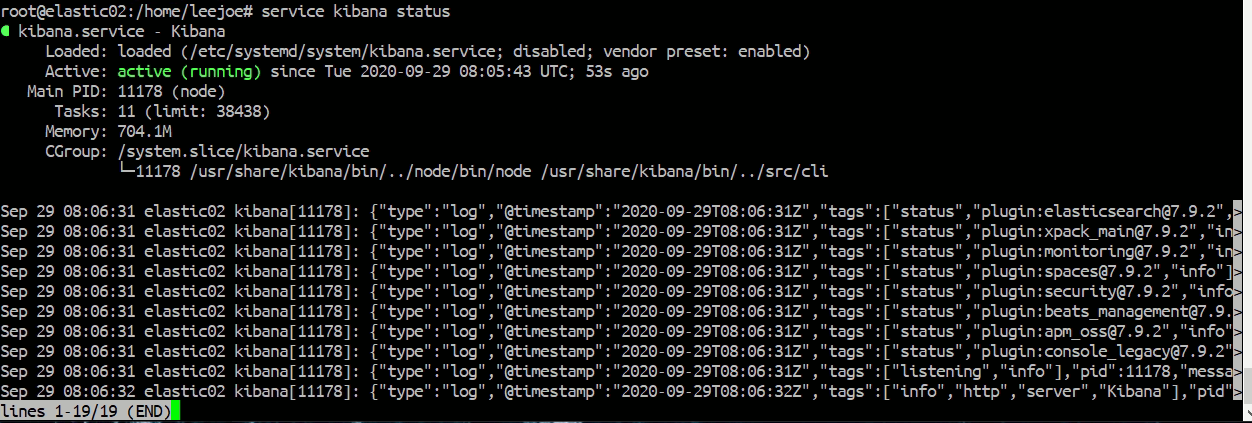
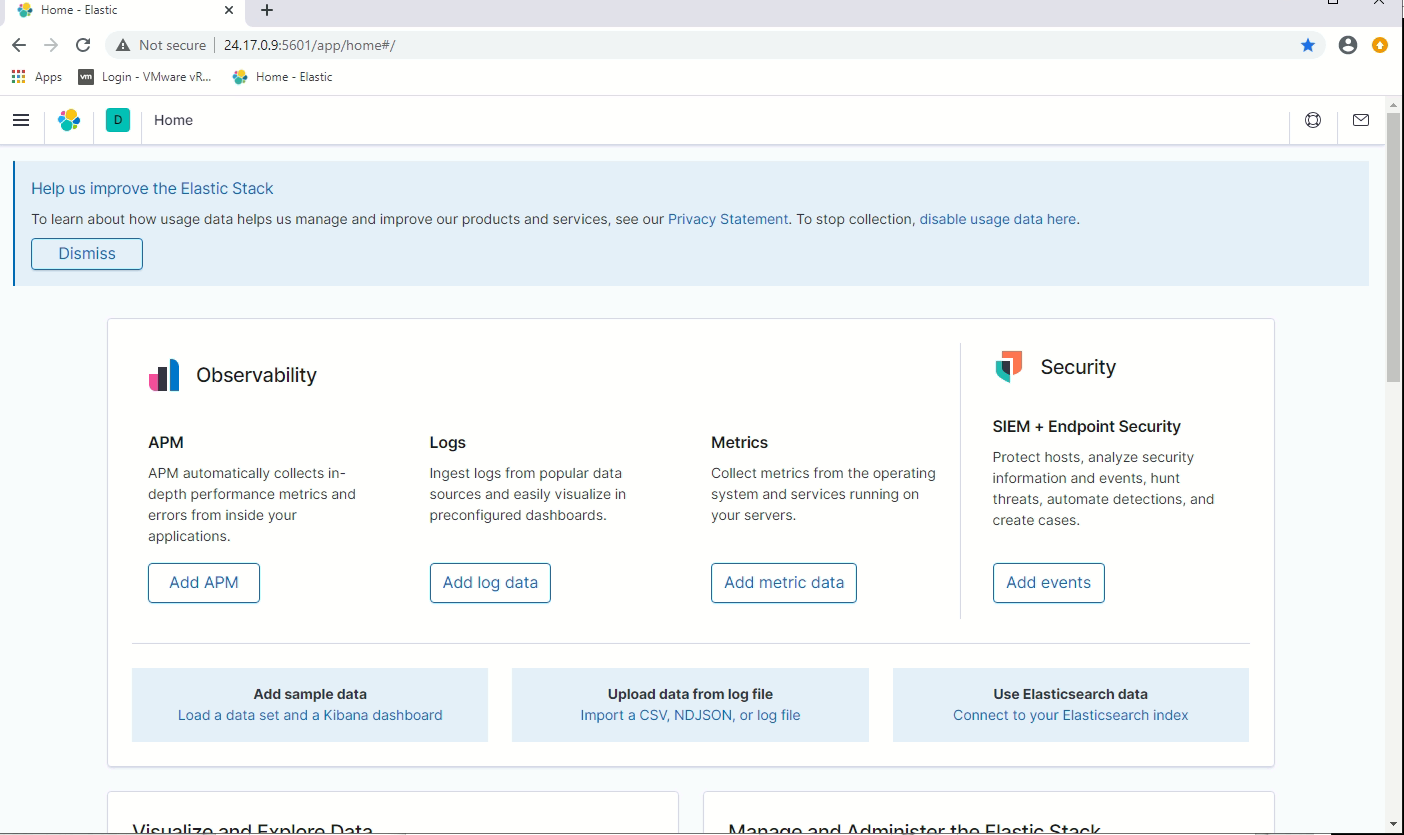
Further verify by pointing the Chrome Browser to the Ubuntu IP address with port 5601, if the Kibana is running properly, should be able to see a page similar to this:
Installation of Logstash
Since I am going to have a single Ubuntu hosting all three Elasticsearch, Kibana and Logstash, and Elasticsearch is already installed, at this stage, can go ahead to use apt to install Logstash:
root@elastic02:/home/leejoe# apt install logstashConfiguring Logstash for Elastiflow
It is time to download the Elastiflow from github. In this example, download the Elastiflow to /var/tmp
root@elastic02:/var/tmp# wget https://github.com/robcowart/elastiflow/archive/master.zipRename the master.zip to elastiflow.zip and then unzip the elastiflow.zip:
root@elastic02:/var/tmp# mv master.zip elastiflow.zip
root@elastic02:/var/tmp# unzip elastiflow.zip
The following steps are from the procedure “Setting up Logstash” in INSTALL.md
- Tune Linux for improved UDP Throughput. Copy 87-elastiflow.conf into /etc/sysctl.d
root@elastic02:/var/tmp# cp /var/tmp/elastiflow-master/sysctl.d/87-elastiflow.conf /etc/sysctl.d/2. Increase Logstash Priority
Edit /etc/systemd/system/logstash.service by change the line “Nice=19” to “Nice=0”. The screen capture below shows the grep output after the change

- Set JVM heap size
In this example, I am using the value of 4GB for JVM heap. Edit the /etc/logstash/jvm.options such that the two lines “-Xms1g” and “-Xmx1g” becomes “-Xms4g” and “-Xmx4g“. The screen capture below shows the grep output after the change:

4. Add and Update required Logstash plugins, such as sFlow
Issue the following commands:
root@elastic02:/etc/logstash# /usr/share/logstash/bin/logstash-plugin install logstash-codec-sflow
root@elastic02:/etc/logstash# /usr/share/logstash/bin/logstash-plugin update logstash-codec-netflow
root@elastic02:/etc/logstash# /usr/share/logstash/bin/logstash-plugin update logstash-input-udp
root@elastic02:/etc/logstash# /usr/share/logstash/bin/logstash-plugin update logstash-input-tcp
root@elastic02:/etc/logstash# /usr/share/logstash/bin/logstash-plugin update logstash-filter-dns
root@elastic02:/etc/logstash# /usr/share/logstash/bin/logstash-plugin update logstash-filter-geoip
root@elastic02:/etc/logstash# /usr/share/logstash/bin/logstash-plugin update logstash-filter-translate
5. Copy the pipeline files to the Logstash configuration path
Issue the follow command to copy the elastiflow folder to /etc/logstash
root@elastic02:/etc/logstash# cp -R /var/tmp/elastiflow-master/logstash/elastiflow/ /etc/logstash/6. Setup environment variable helper files
The goal is to copy the logstash.service.d/elastiflow.conf to /etc/systemd/system/logstash.service.d/ folder
root@elastic02:/etc/logstash# mkdir /etc/systemd/system/logstash.service.d
root@elastic02:/etc/logstash# cp /var/tmp/elastiflow-master/logstash.service.d/elastiflow.conf /etc/systemd/system/logstash.service.d
root@elastic02:/etc/logstash#
It is required to edit /etc/systemd/system/logstash.service.d/elastiflow.conf to let Logstash knows is there an array of Elasticsearch or a single Elasticsearch. In this post, there is only a single Elasticsearch, thus, comment out the following 3 lines:
Environment="ELASTIFLOW_ES_HOST_1=127.0.0.1:9200"
Environment="ELASTIFLOW_ES_HOST_2=127.0.0.2:9200"
Environment="ELASTIFLOW_ES_HOST_3=127.0.0.3:9200"
After commented out the Elasticsearch array configuration, the output will be as the screen capture below with this grep command:

In order to have the changes to take, issue “sudo systemctl daemon-reload”:
root@elastic02:/etc/logstash# systemctl daemon-reload
root@elastic02:/etc/logstash#
7. Configure the Logstash pipelines
The pipelines configuration for Logstash is located at /etc/logstash/pipelines.yml. Since the Elastiflow is the only pipelines will be used in this Elastic Stack, what we need to do is comment out the default main pipeline and add the following two lines to pipelines.yml
- pipeline.id: elastiflow
path.config: "/etc/logstash/elastiflow/conf.d/*.conf"
The following screen capture shows how pipelines.yml looks like after the change:

8. Inputs for Logstash
There are situation you might need to adjust the inputs for Elastiflow, which the configuration files are located at “/etc/logstash/elastiflow/conf.d“. In this demonstration, the default looks good, so there is no changes being made.
9. DNS name resolution
By default, the Elastiflow does not resolve the IP address to DNS name for flow exporter (Velocloud Edge in this case) and endpoints. In this demonstration, DNS name resolution will not be enabled, thus, no configuration change is required.
If you are interested in enabling the DNS name resolution, check “Enable DNS name resolution (optional)” in the Elastiflow INSTALL.md (https://github.com/robcowart/elastiflow/blob/master/INSTALL.md)
10. Install the Logstash init files
Install the Logstash init files by command “/usr/share/logstash/bin/system-install“
root@elastic02:/etc/logstash# /usr/share/logstash/bin/system-install
OpenJDK 64-Bit Server VM warning: Option UseConcMarkSweepGC was deprecated in version 9.0 and will likely be removed in a future release.
/usr/share/logstash/vendor/bundle/jruby/2.5.0/gems/pleaserun-0.0.31/lib/pleaserun/platform/base.rb:112: warning: constant ::Fixnum is deprecated
Successfully created system startup script for Logstash
root@elastic02:/etc/logstash#
Starting Logstash service
Before starting the Logstash, it can be a good idea to run “systemctl daemon-reload” one more time, which will ensure any changes of the environment variables are getting effective.
root@elastic02:/etc/logstash# systemctl daemon-reloadroot@elastic02:/etc/logstash#
To start the Logstash service, run “systemctl start logstash”:
root@elastic02:/etc/logstash# systemctl start logstash
root@elastic02:/etc/logstash#
The Logstash takes some time to get started (in my environment it takes about 1 minute), it is recommended to check the /var/log/logstash/logstash-plain.log to see the progress and also check any error messages.
The following is a screen capture showing the last few lines of “tail -F /var/log/logstash/logstash-plain.log“
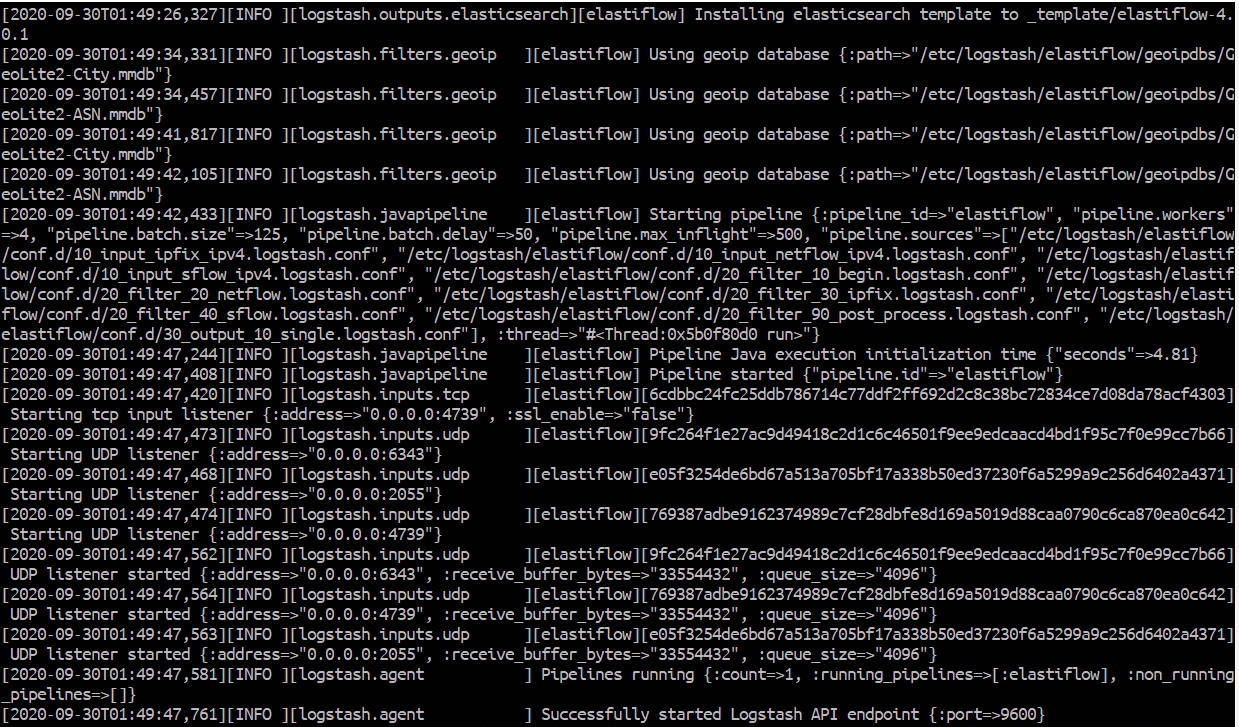
The installation and configuration of Logstash are done at this point.
Setting up Kibana
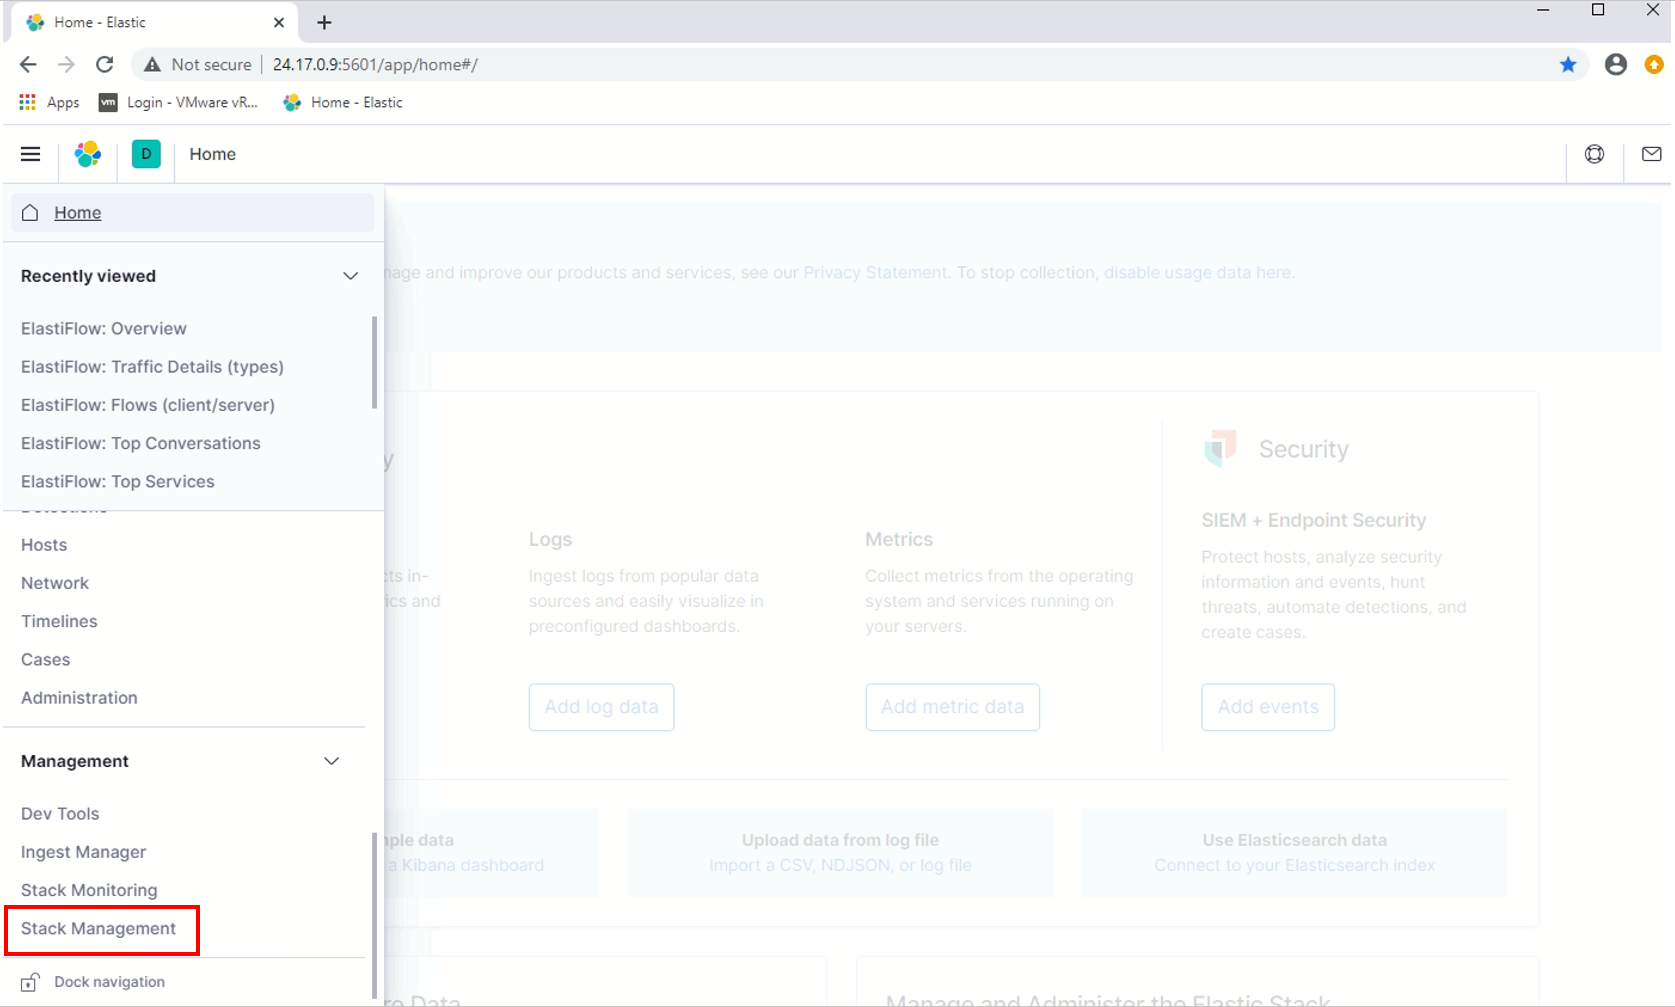
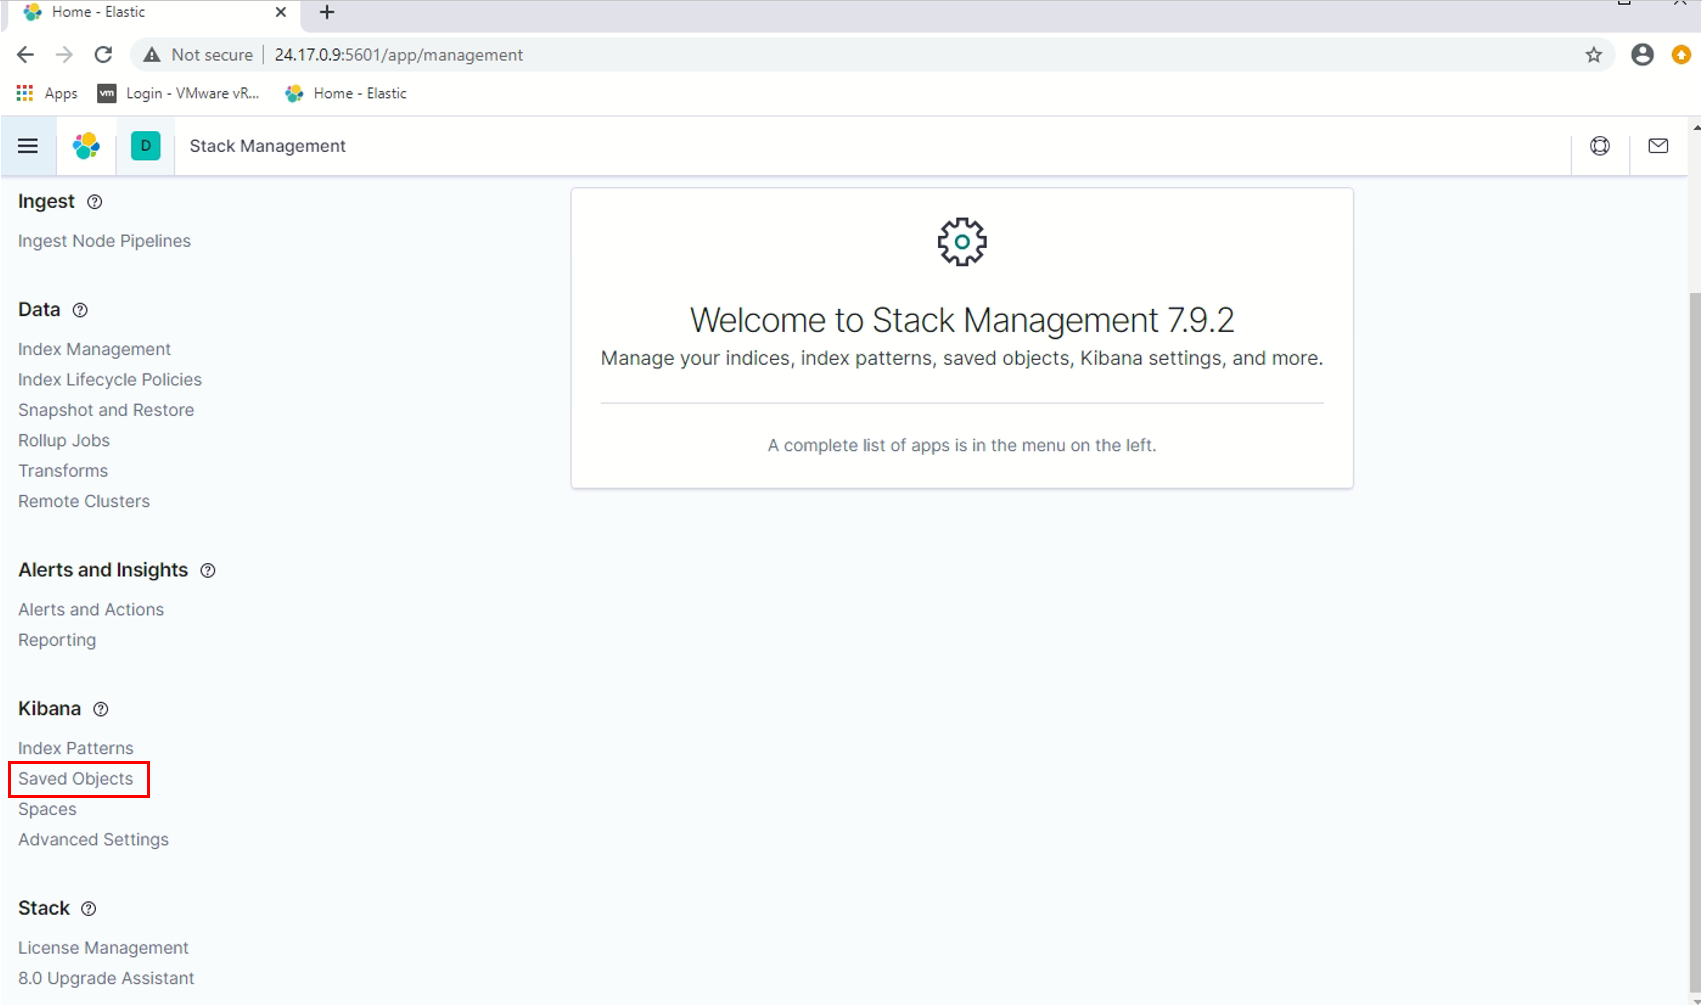
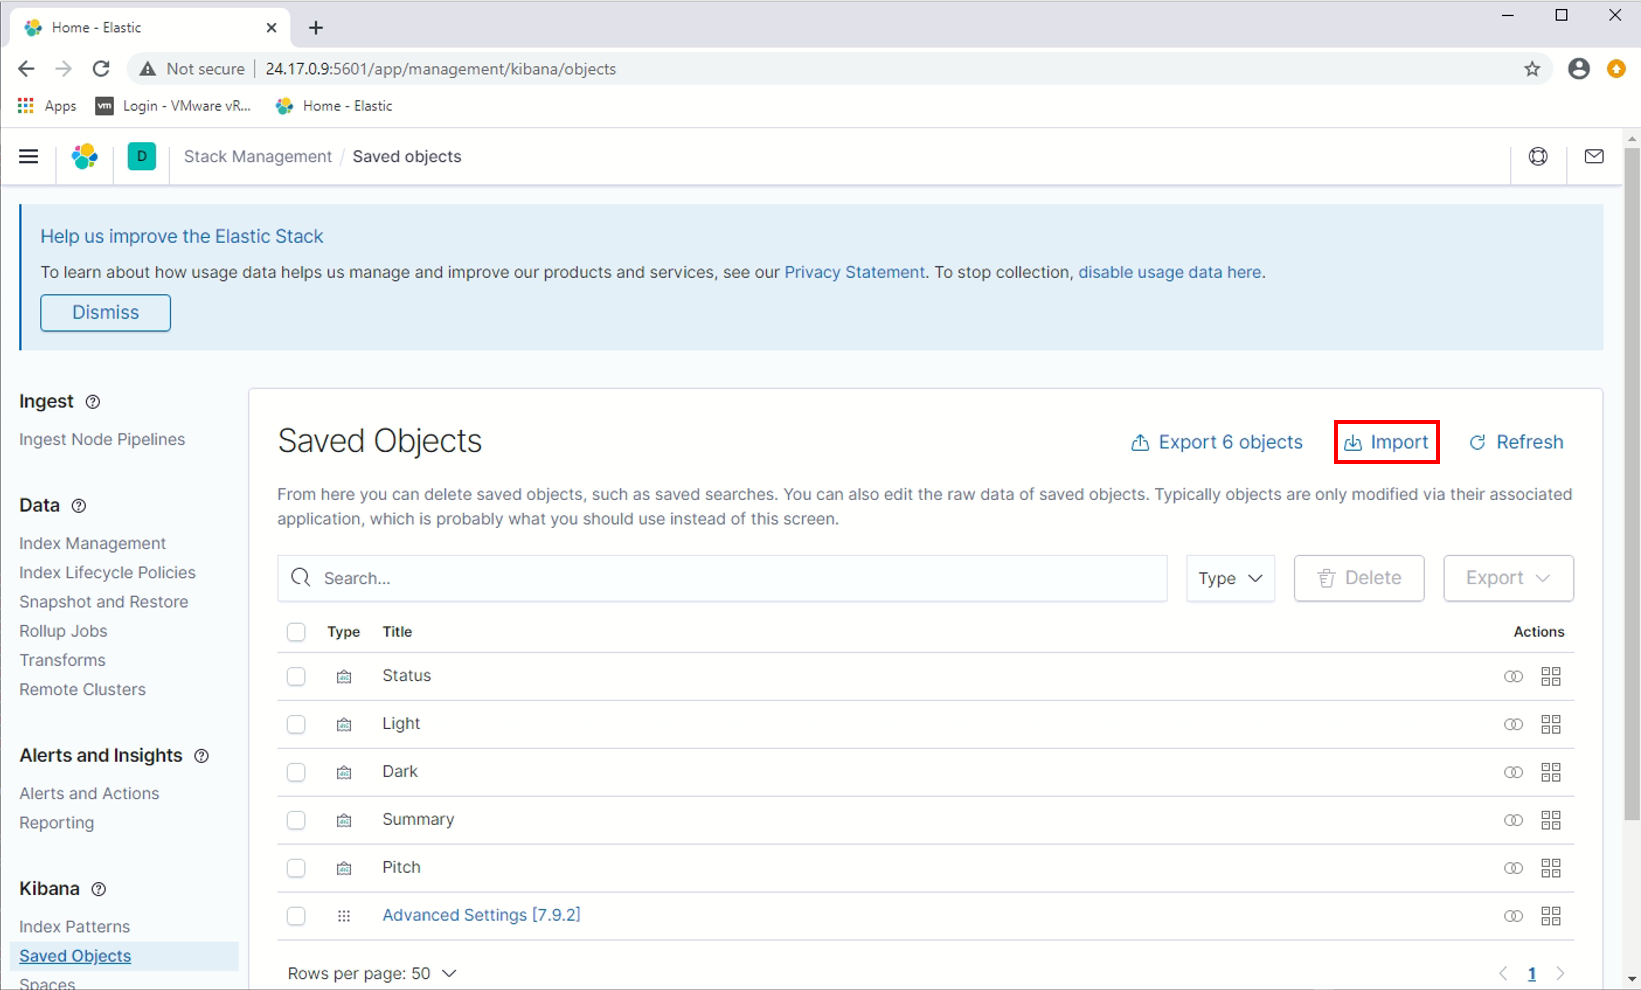
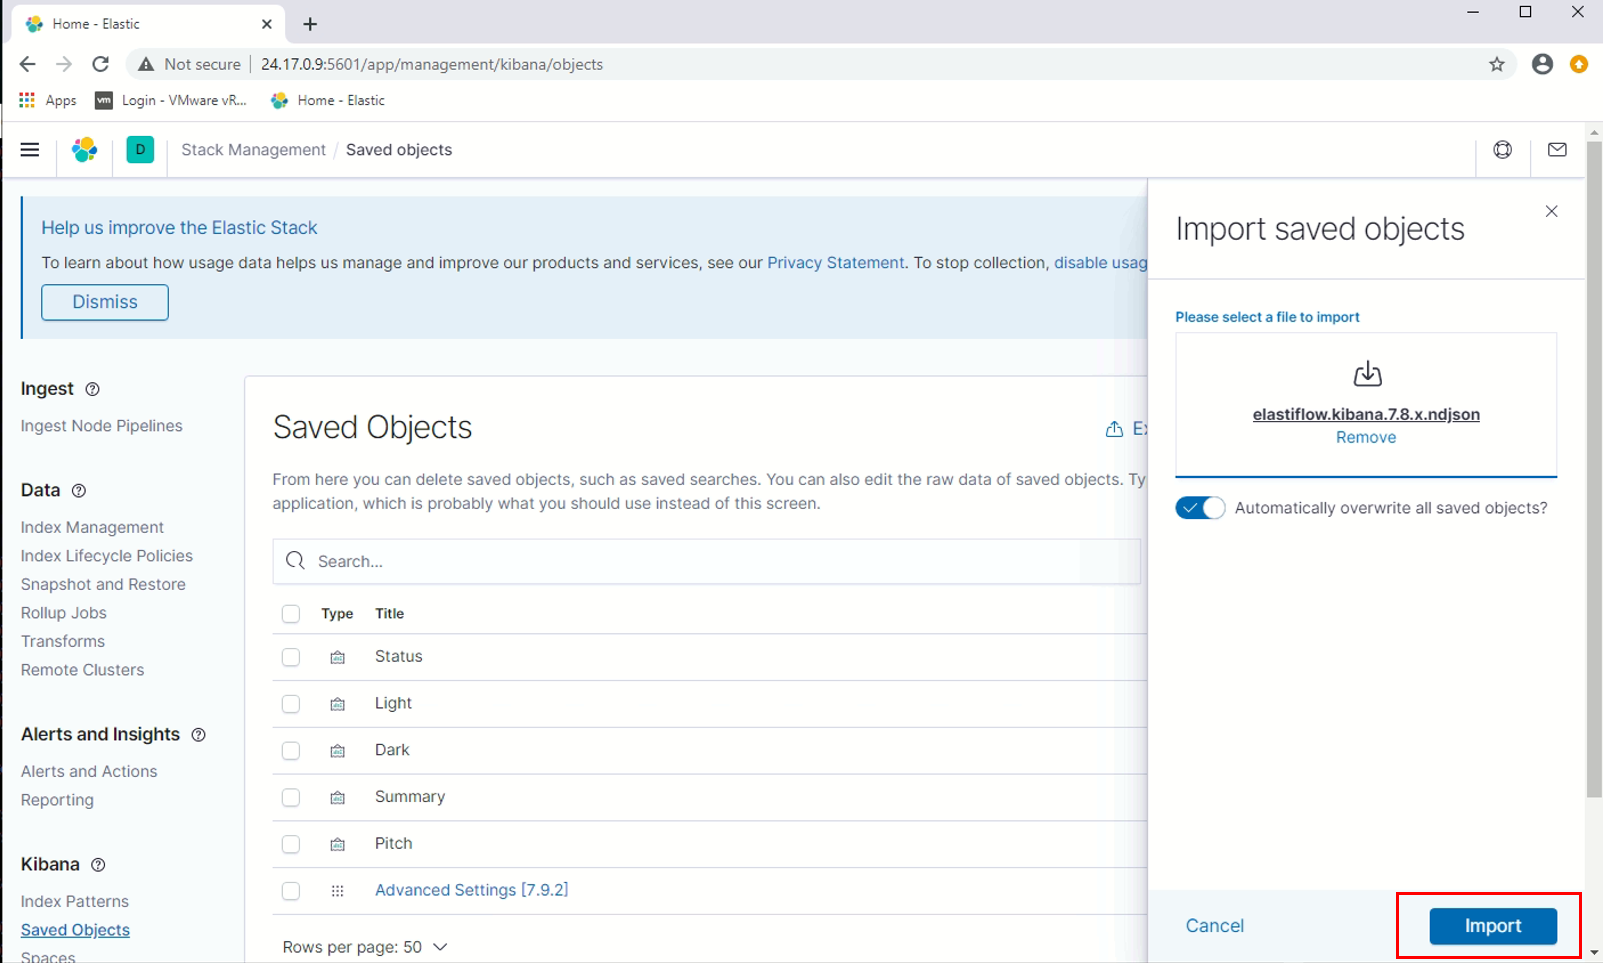
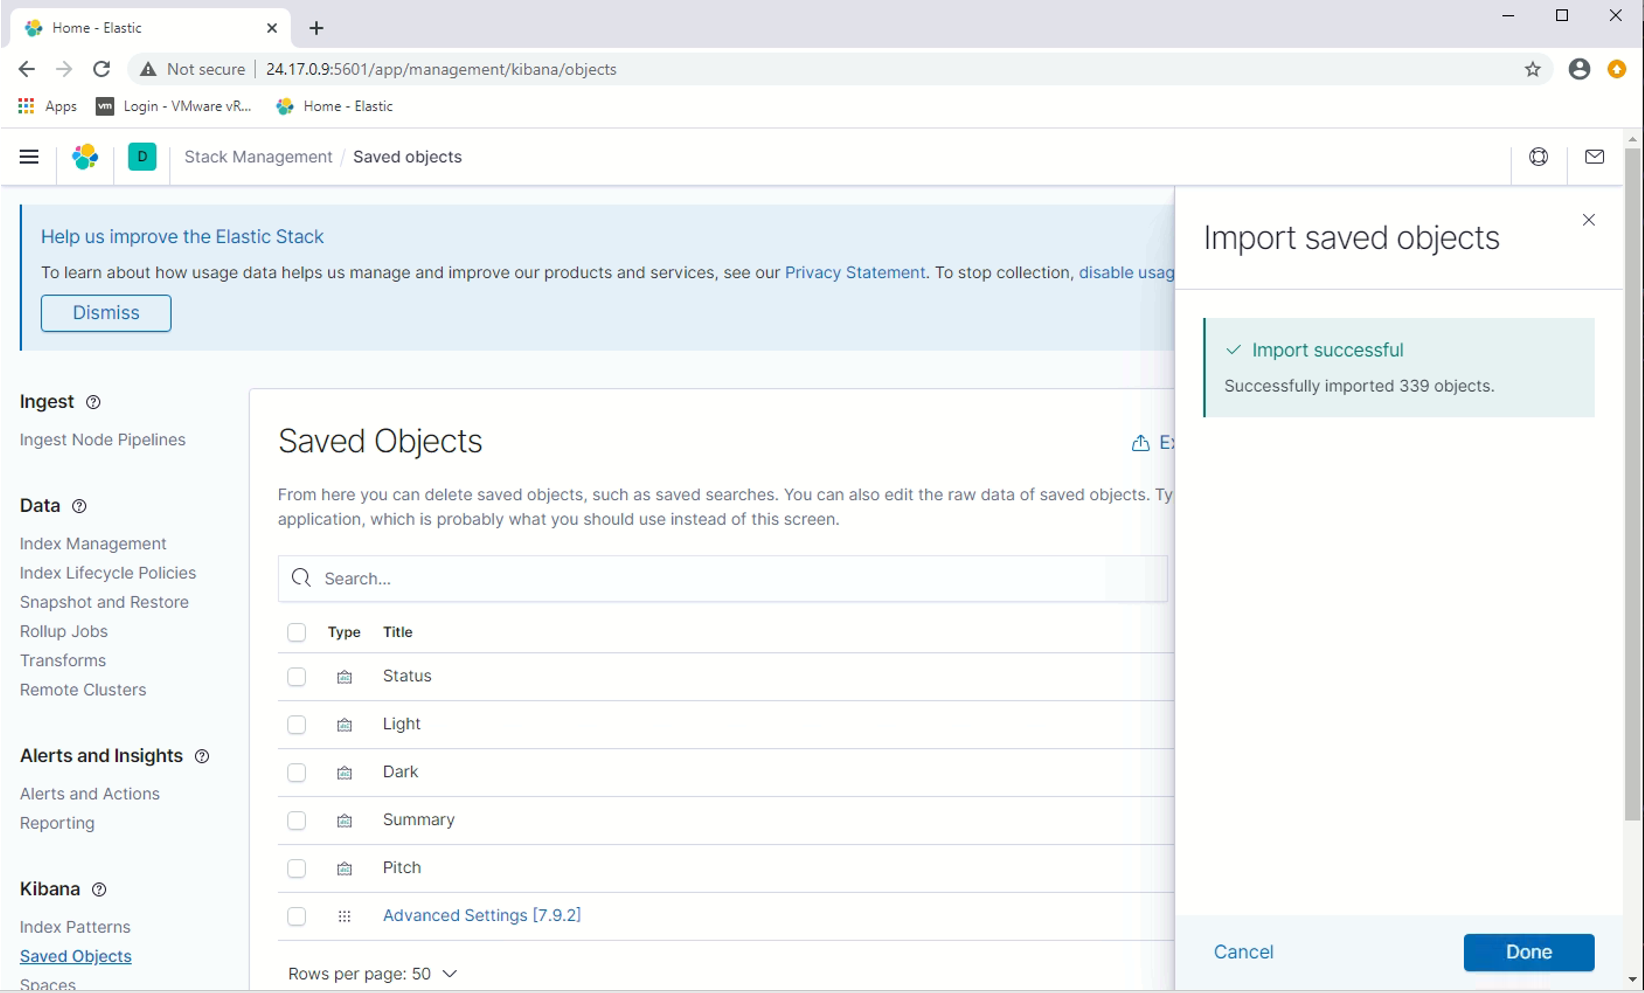
To load the Elastiflow dashboard to Kibana, import /kibana/elastiflow.kibana.7.8.x.ndjson (https://github.com/robcowart/elastiflow/blob/master/kibana/elastiflow.kibana.7.8.x.ndjson) in the Kibana UI. To do this, go to Management –> Stack Management –> Kibana Saved Objects and select Import.
Follow the following 5 screen captures (Figure 13 – Figure 17) for the exact steps:
Apply the “Recommended Kibana Advanced Settings”
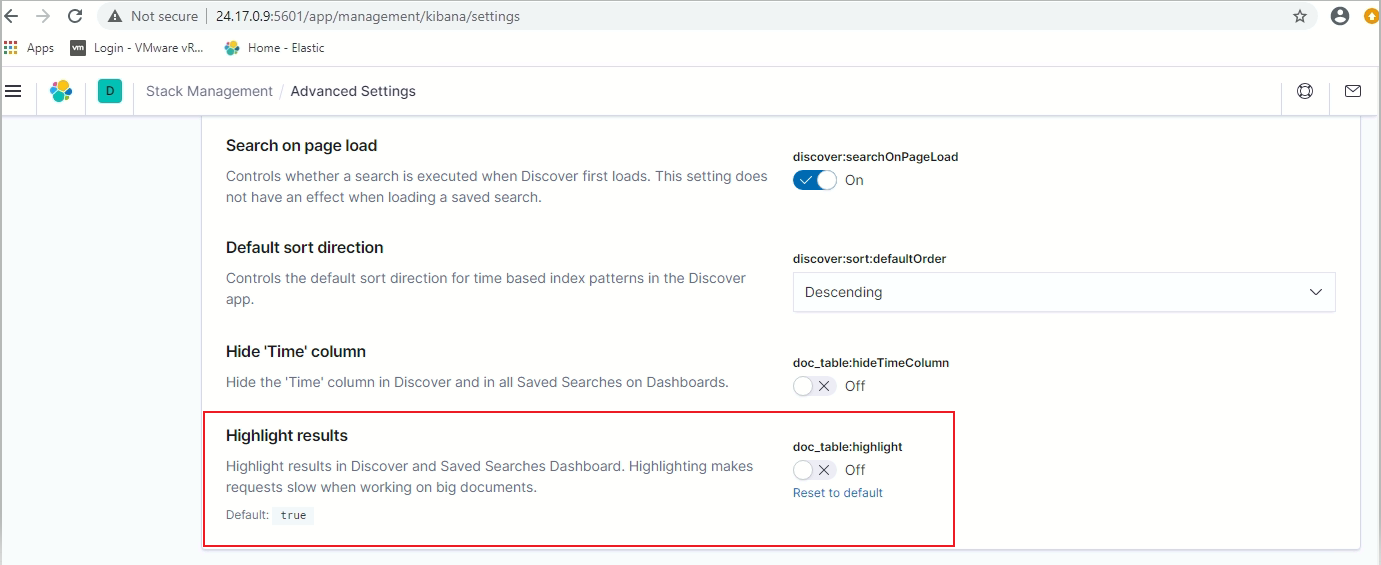
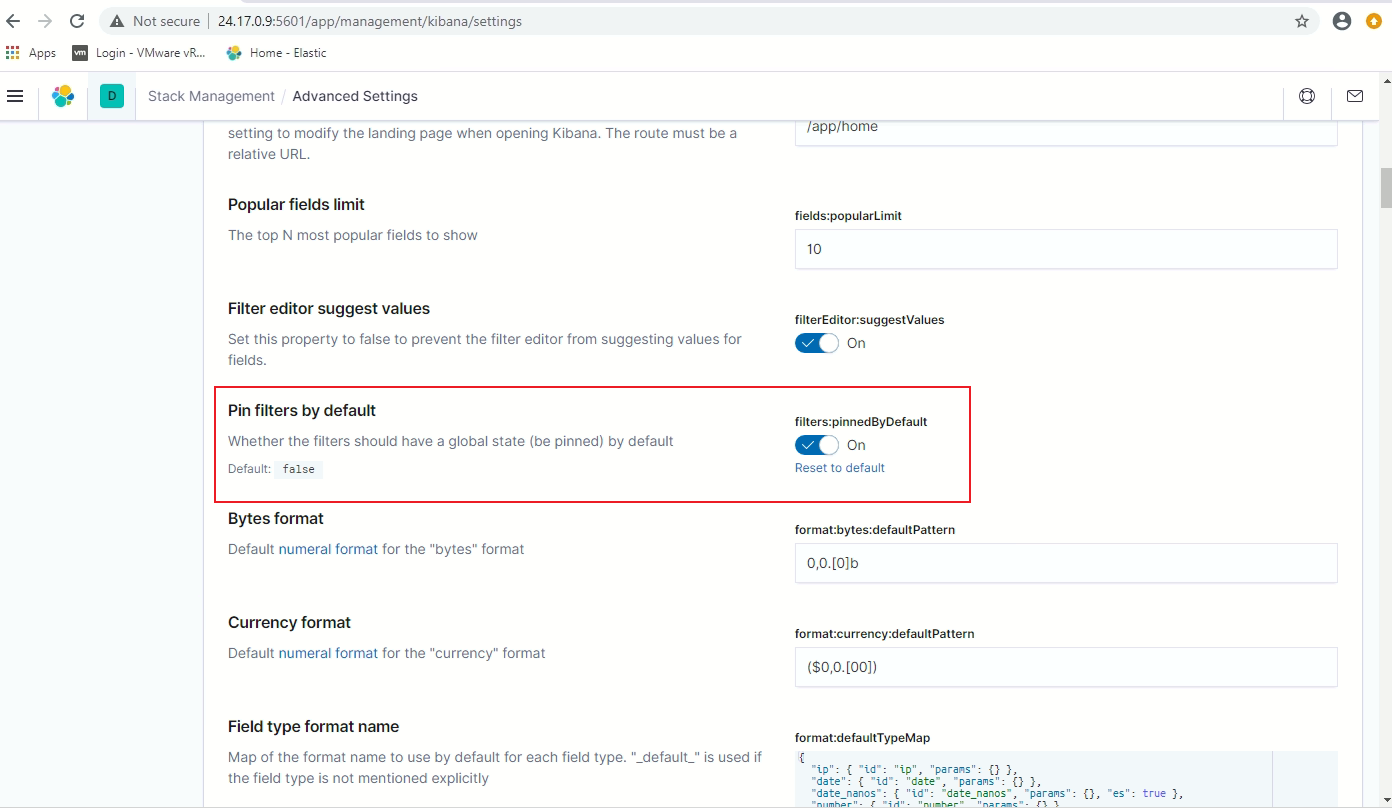
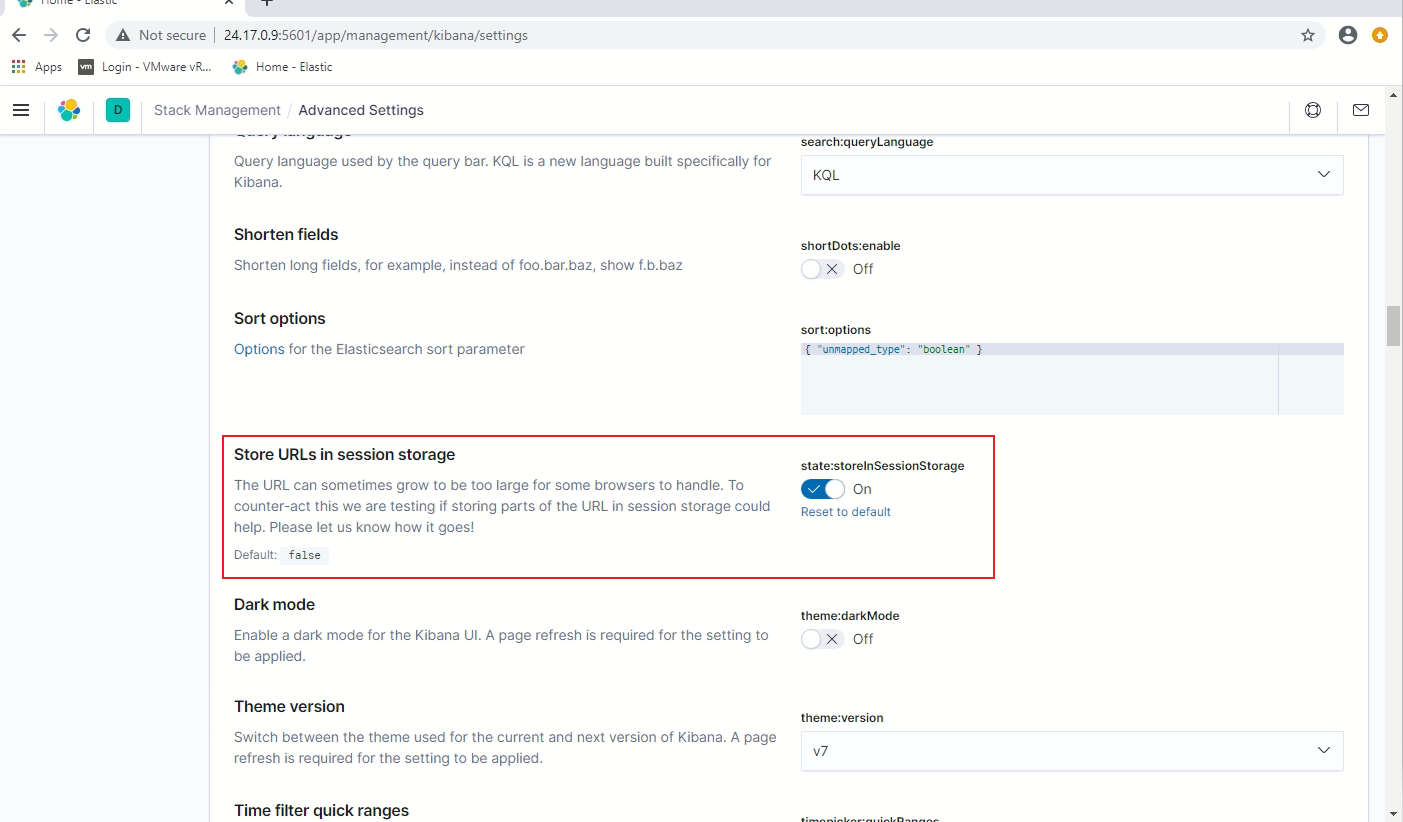
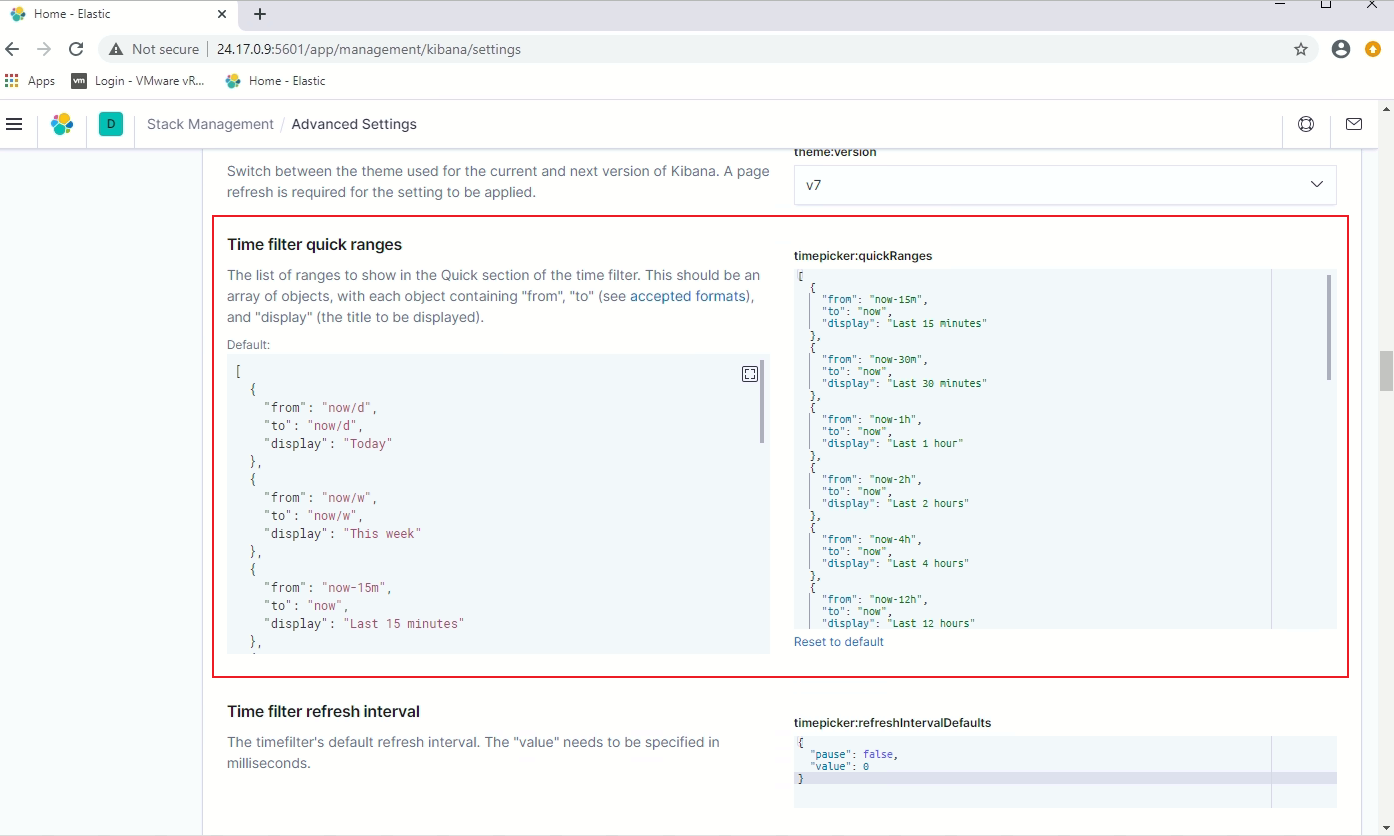
The INSTALL.md documented very well on how and why some Kibana Advanced Settings need to be changed. Here will not repeat those, instead, the follow screen captures (Figure 18 – Figure 21) show how the settings look like after applied the recommended settings:
doc_table:highlight
filters:pinnedByDefault
state:storeInSessionStorage
timepicker:quickRanges
The Elasticflow setup and configuration are completed at this point.
VMware SD-WAN Edge (Velocloud Edge) configuration
To instruct the Velocloud Edge (VCE) sending the IPFIX netflow to the Elastiflow virtual machine, follow the steps below
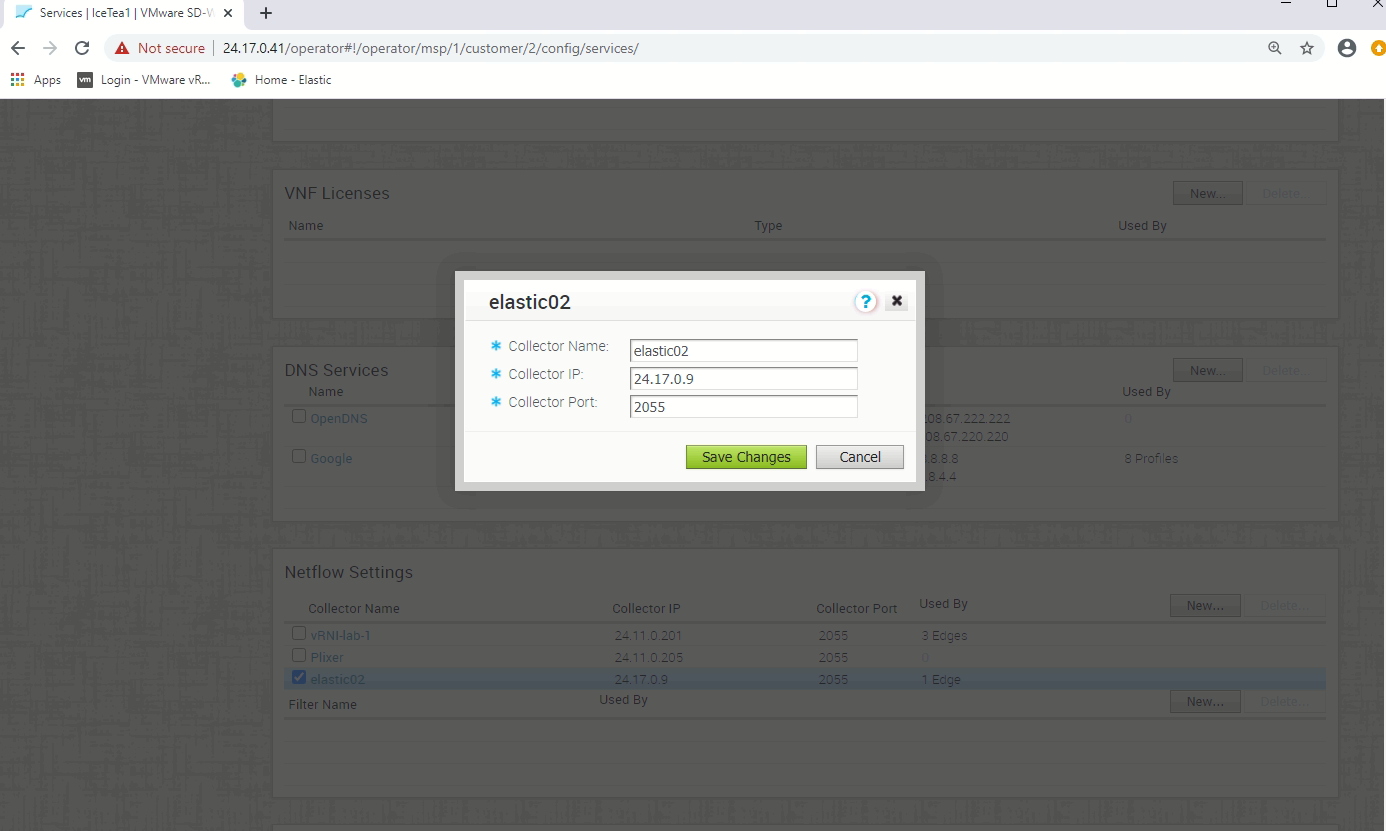
- Add the Elastiflow IP address 24.17.0.9 with port number 2055 as Netflow Collector by: Configure –> Network Services –> Netflow Settings:
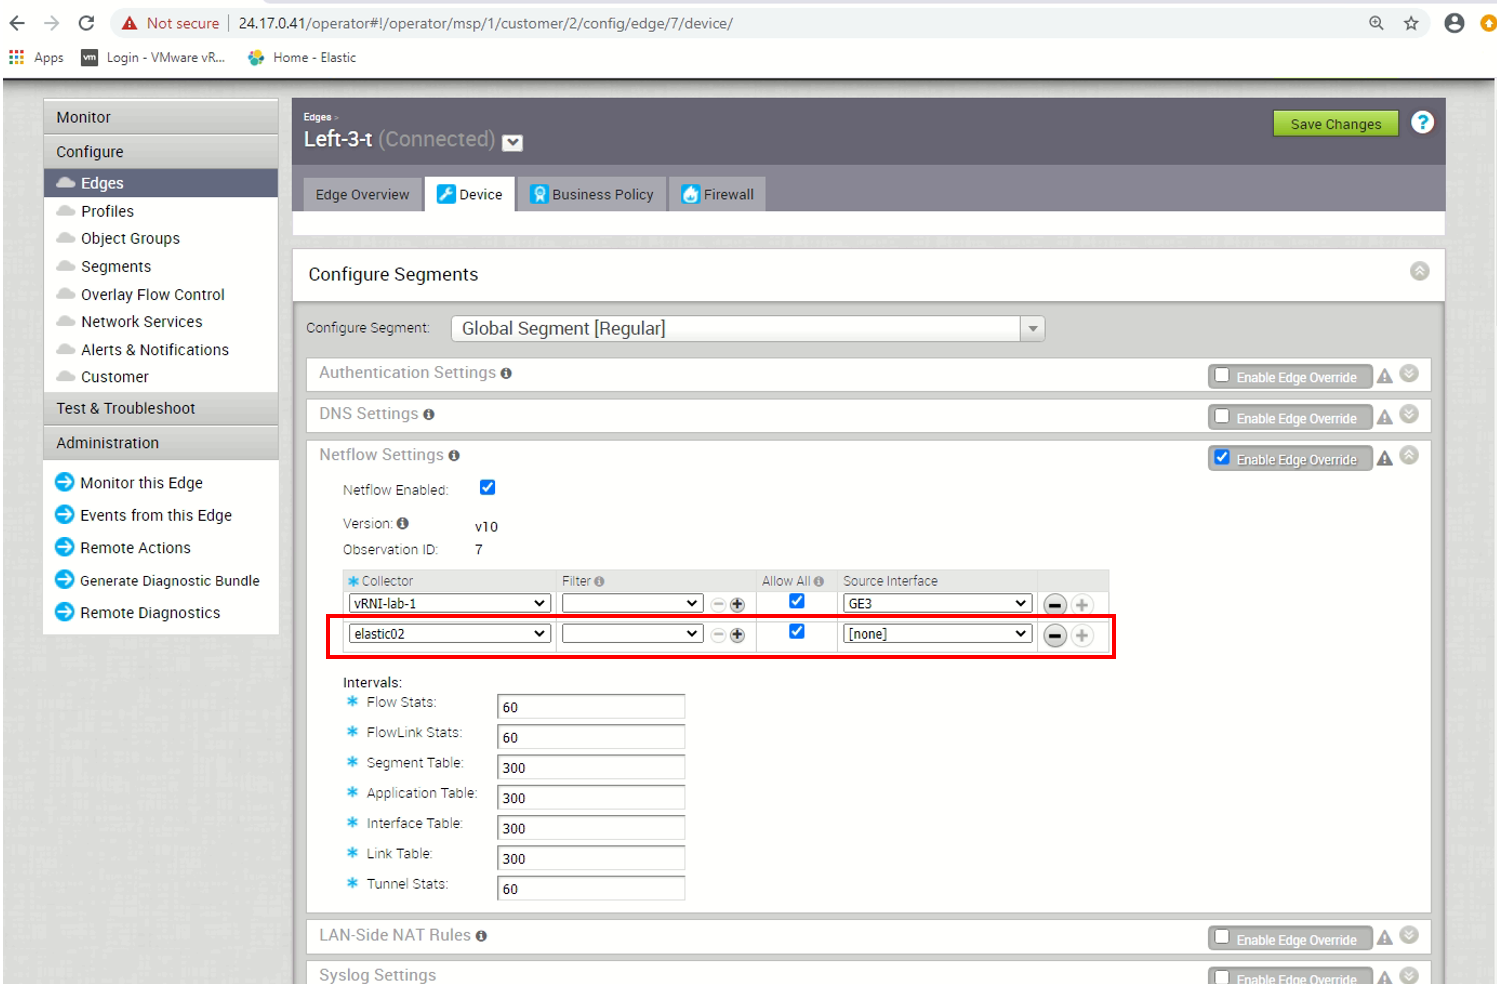
- In the VCE (Edge-3-t in this example), enable the Netflow with this elastic02 collector under “Configure –> Edges –> Netflow Settings”
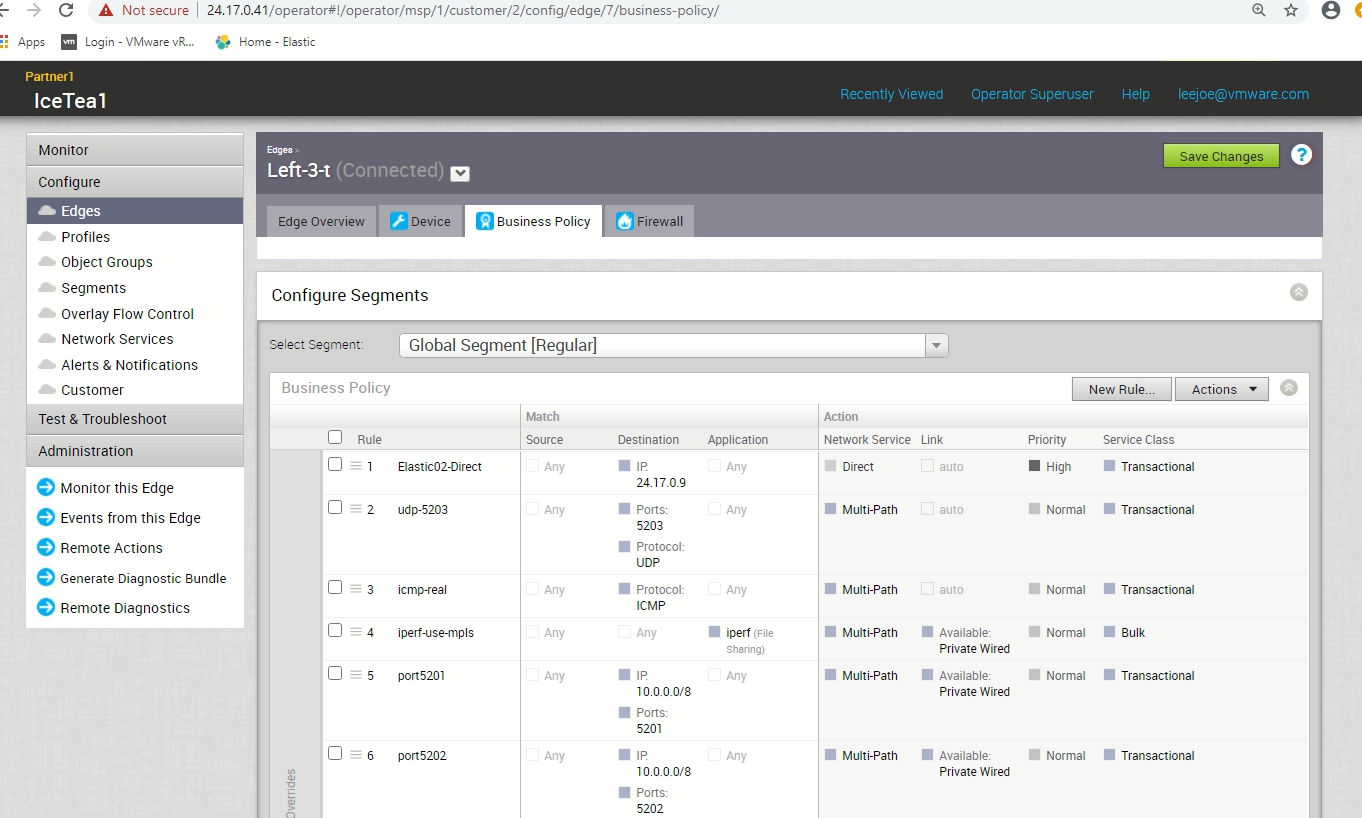
- (Optional) In this lab test, I would like the VCE sending out the Netflow IPFIX packets directly on the Internet interface, that is local breakout instead of going via the SD-WAN Gateway. That’s why I have added a business policy called Elastic02-Direct for this purpose, this business policy makes the VCE sending traffic destinated to 24.17.0.9 (that is the Elastiflow) sending out direct.
The above 3 steps concludes the Netflow configuration in the Velocloud side.
Checking the Elastiflow Dashboard
If the Netflow setting was just configured in the Velocloud side, I suggest wait for 15 minutes to visit the Elastiflow Dashboard.
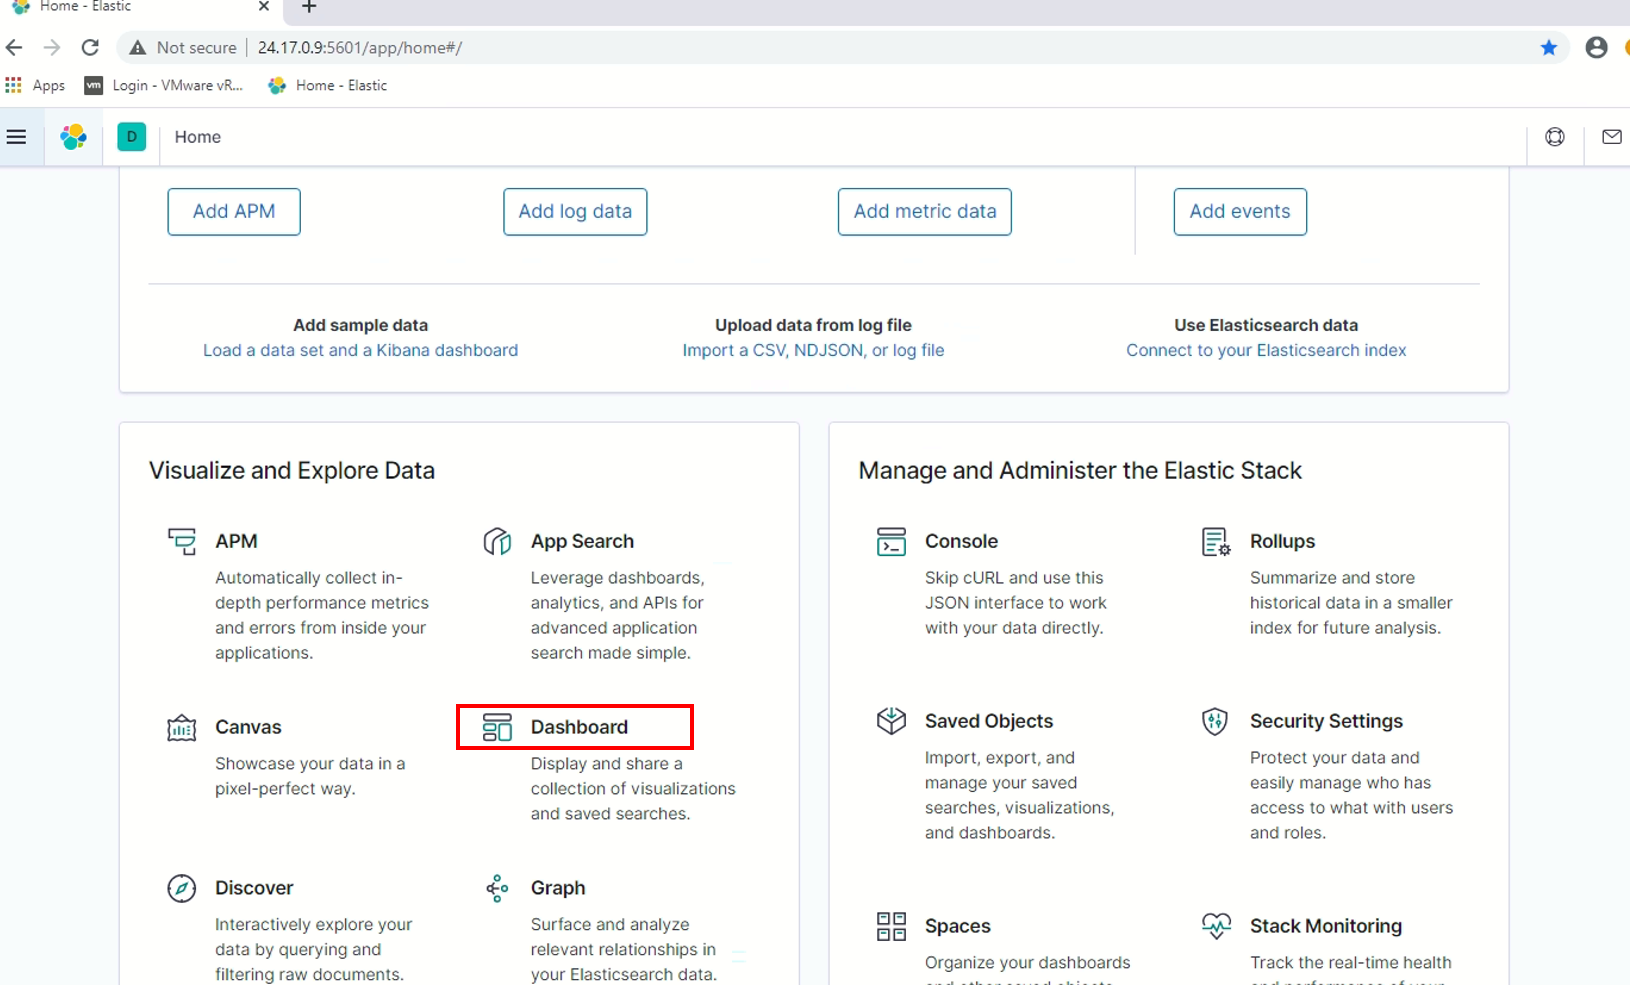
To visit the Elastiflow Dashboard, in the Kibana Home, click on Dashboard:
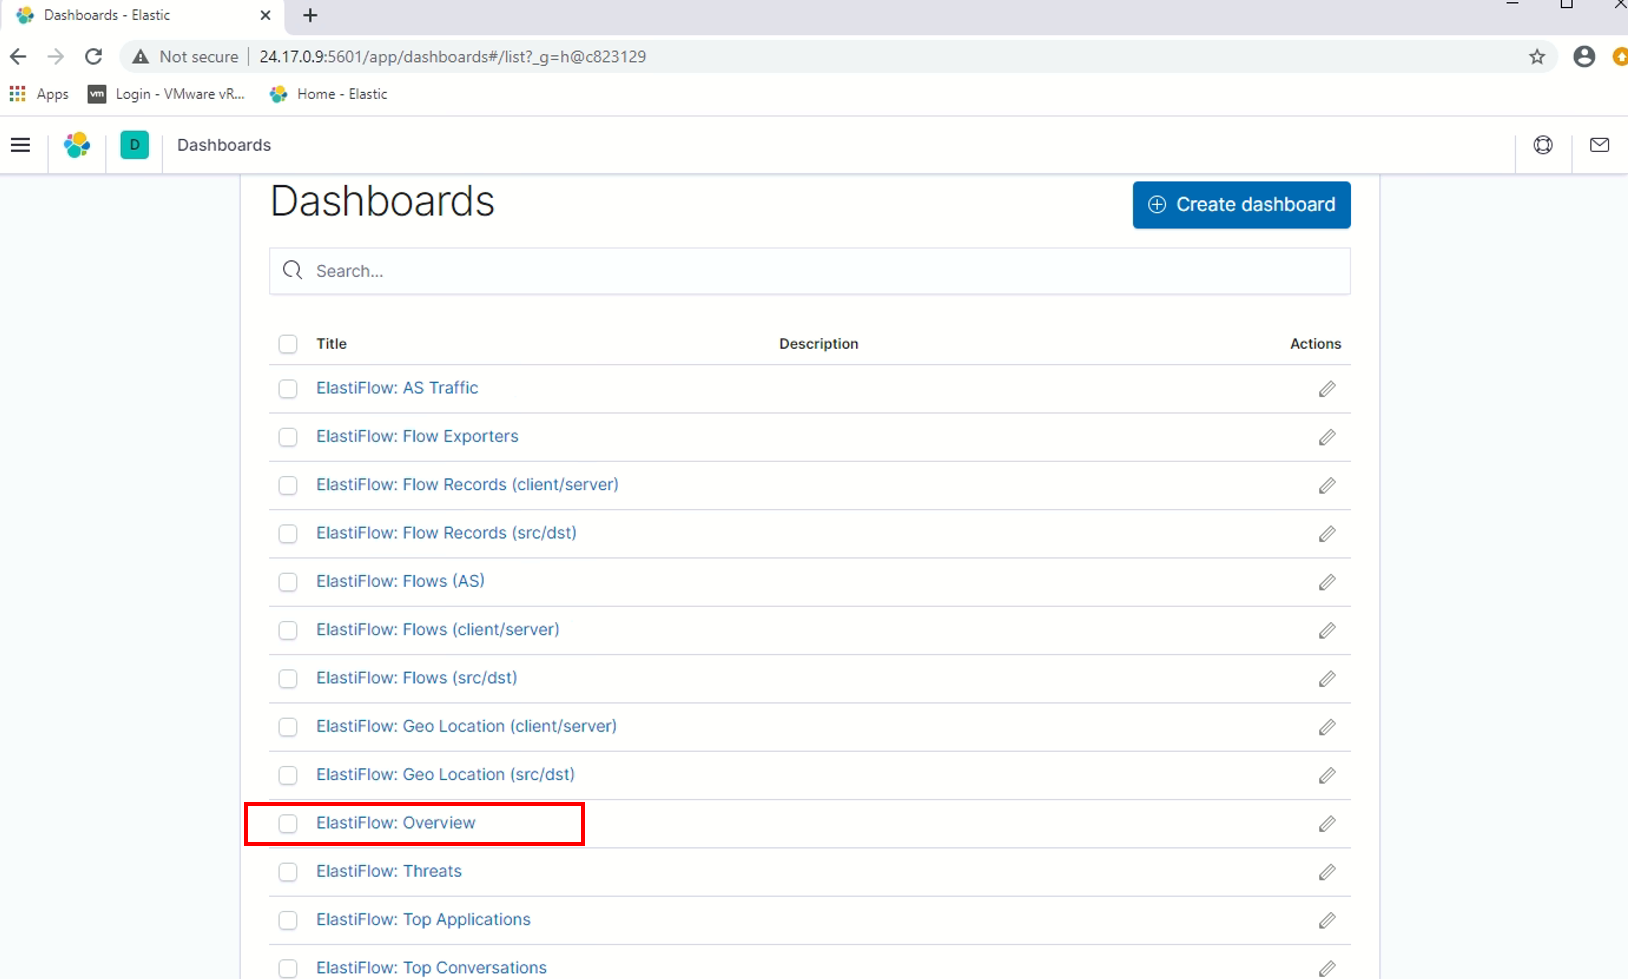
Click on the “ElastiFlow: Overview”, which is the landing page for ElastiFlow:
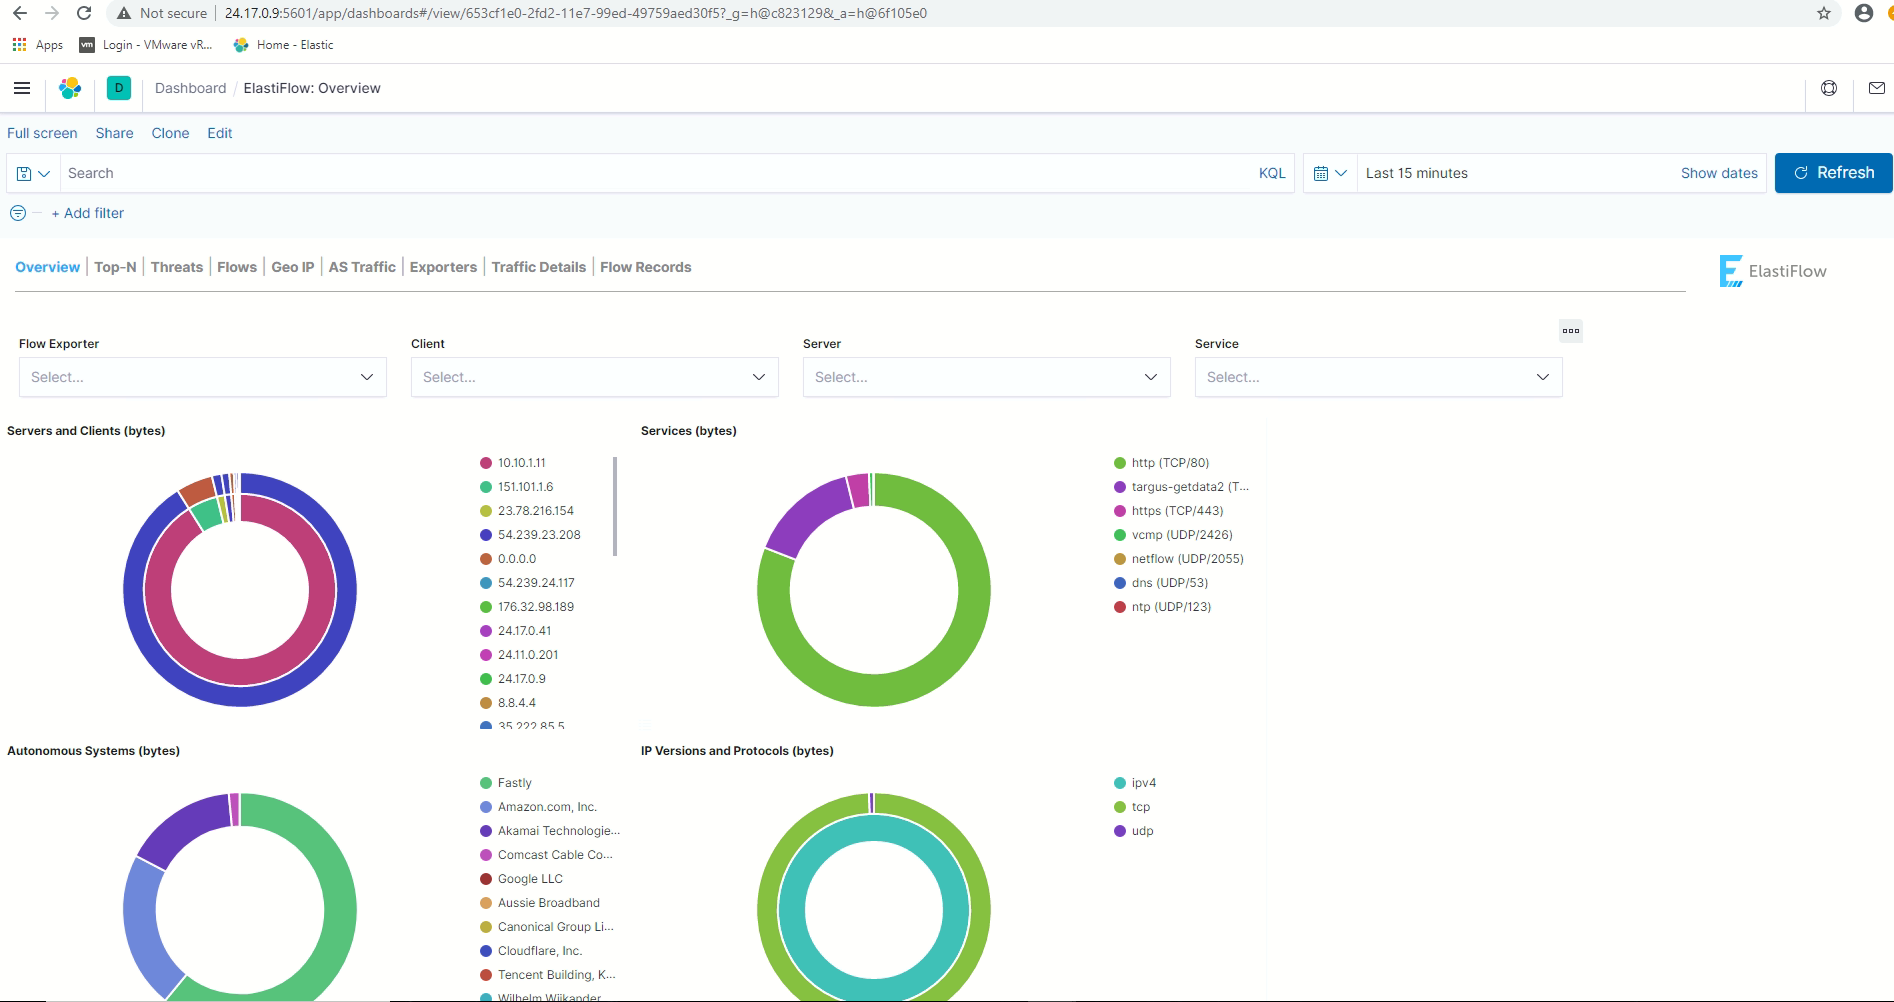
The “Figure 27” below is the sample screen capture of “Elastiflow Overview” from this test lab environment:
Adding one more sample screen capture of “ElastiFlow Top-N”:
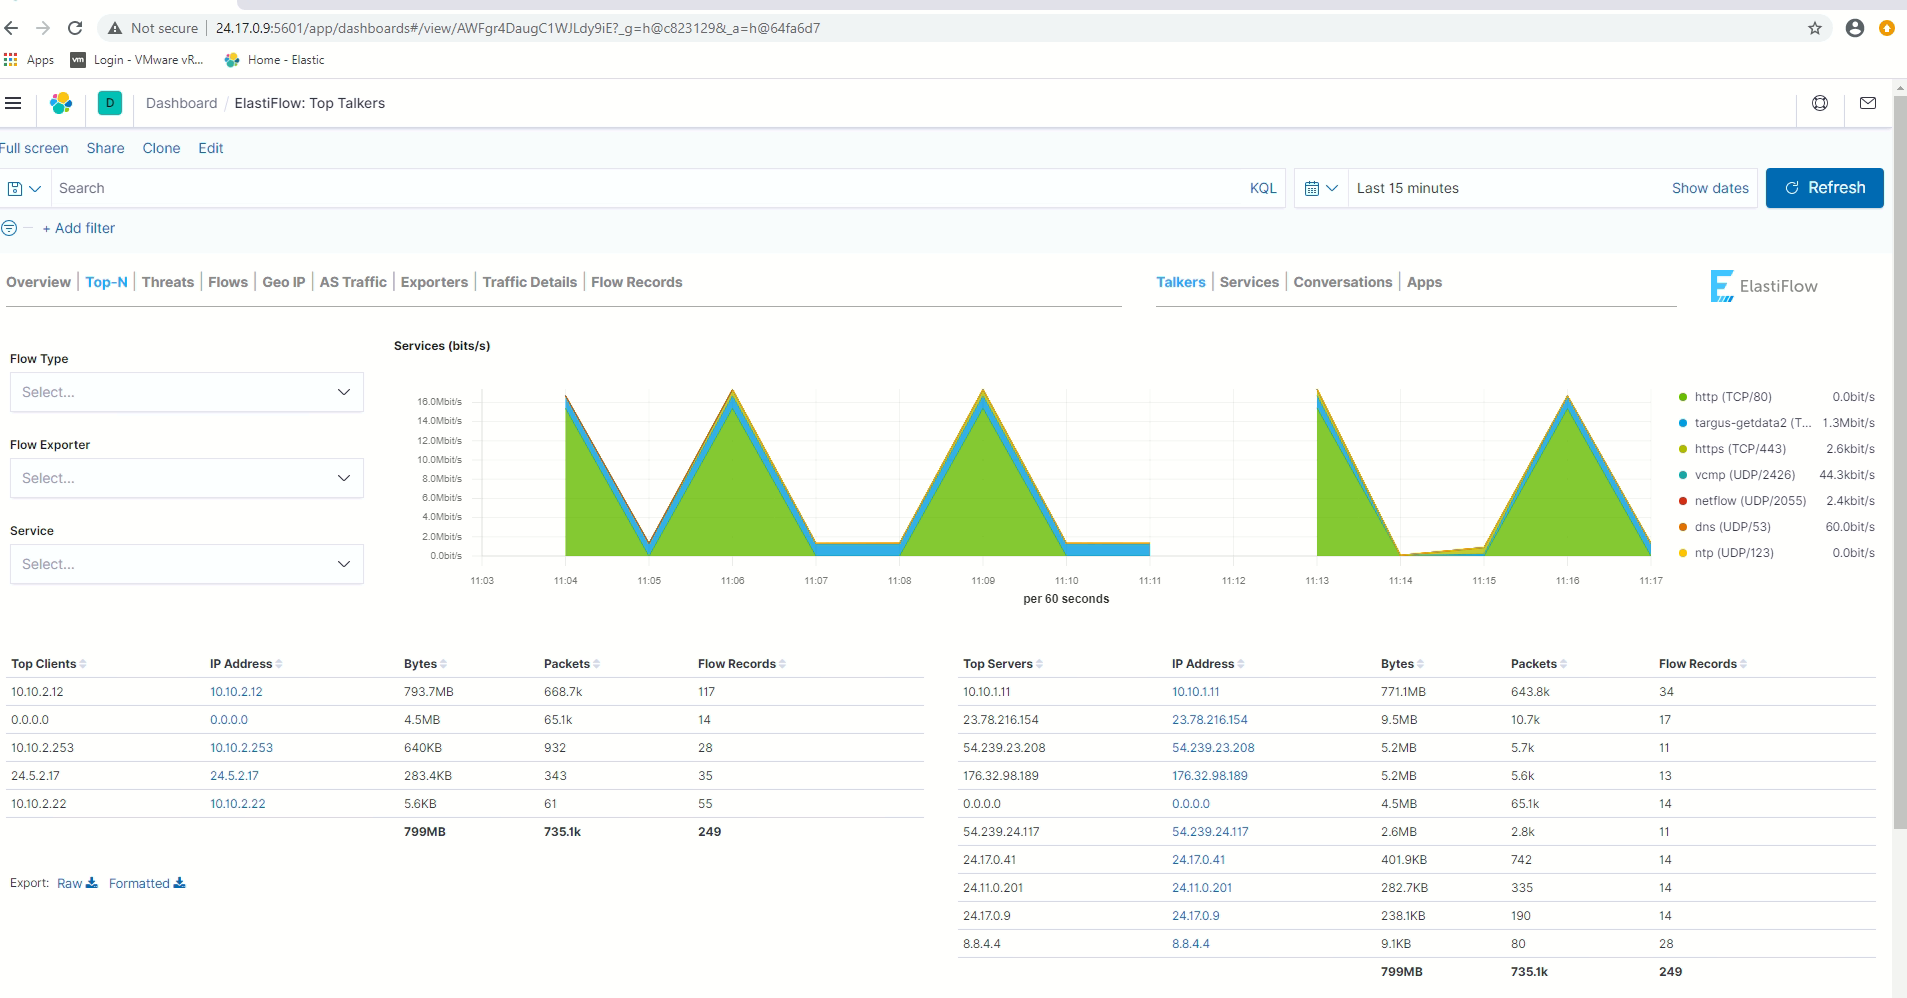
By browsing different ElastiFlow dashboard, can confirm this Ubuntu VM running ElastiFlow is able to receive Netflow from the VCE and report the flows in different dashboards.
This meets the objective of this post.
Elastiflow and VMware SD-WAN by Velocloud – Part 1 is completed here.
Hello
Please help to bug fix
[2022-07-01T07:24:25,911][INFO ][logstash.runner ] Log4j configuration path used is: /etc/logstash/log4j2.properties
[2022-07-01T07:24:25,923][INFO ][logstash.runner ] Starting Logstash {“logstash.version”=>”7.17.5”, “jruby.version”=>”jruby 9.2.20.1 (2.5.8) 2021-11-30 2a2962fbd1 OpenJDK 64-Bit Server VM 11.0.15+10 on 11.0.15+10 +indy +jit [linux-x86_64]”}
[2022-07-01T07:24:25,926][INFO ][logstash.runner ] JVM bootstrap flags: [-Xms4g, -Xmx4g, -XX:+UseConcMarkSweepGC, -XX:CMSInitiatingOccupancyFraction=75, -XX:+UseCMSInitiatingOccupancyOnly, -Djava.awt.headless=true, -Dfile.encoding=UTF-8, -Djdk.io.File.enableADS=true, -Djruby.compile.invokedynamic=true, -Djruby.jit.threshold=0, -Djruby.regexp.interruptible=true, -XX:+HeapDumpOnOutOfMemoryError, -Djava.security.egd=file:/dev/urandom, -Dlog4j2.isThreadContextMapInheritable=true]
[2022-07-01T07:24:26,339][FATAL][org.logstash.Logstash ] Logstash stopped processing because of an error: (SystemExit) exit
org.jruby.exceptions.SystemExit: (SystemExit) exit
at org.jruby.RubyKernel.exit(org/jruby/RubyKernel.java:747) ~[jruby-complete-9.2.20.1.jar:?]
at org.jruby.RubyKernel.exit(org/jruby/RubyKernel.java:710) ~[jruby-complete-9.2.20.1.jar:?]
at usr.share.logstash.lib.bootstrap.environment.(/usr/share/logstash/lib/bootstrap/environment.rb:94) ~[?:?]
Thank you