Objective
A sample Grafana dashboard for VMware SD-WAN Gateway (VCG) is included in this post. Next, this post will explain how Telegraf, Prometheus and Grafana work together in the VCG monitoring. Finally, step-by-step guide is included at the end.
Sample Grafana VCG Dashboard for Download
If you are only interested in getting the sample Grafana dashboard for VCG, here you go:
How Telegraf, Prometheus and Grafana work together in VCG Monitoring?
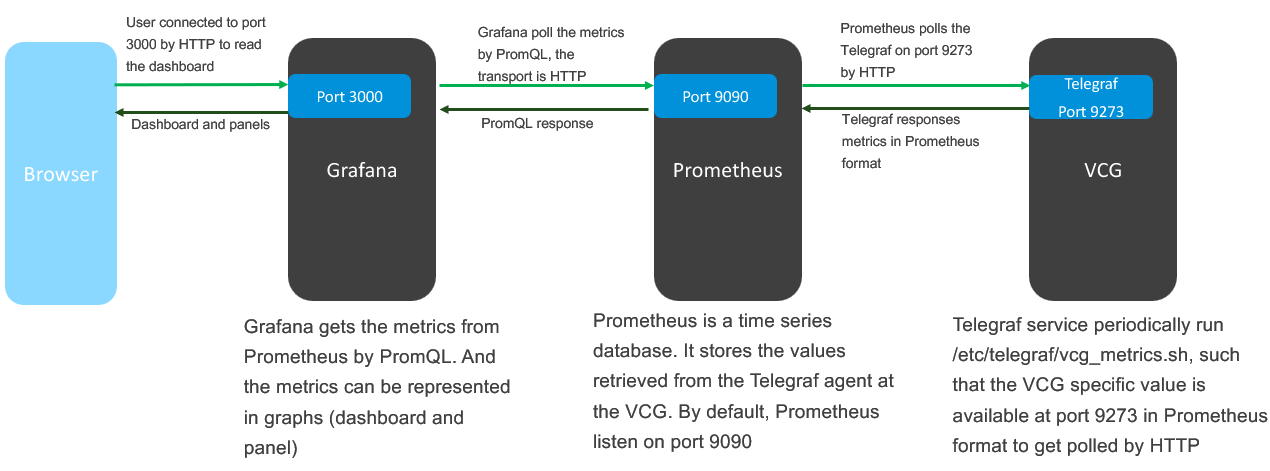
In version 4.3, VCG added the support of monitoring by Telegraf, with VCG specific counters (such as number of tunnels on the VCG). The official document is Monitor Gateways using Telegraf. You can also find the complete list of supported counters in Supported Counters
If you have no idea what are Telegraf, Prometheus and Grafana, I will use the following analogy. One of the classic tools to monitor network device is MRTG, that is there is a monitoring station running MRTG polls network device by SNMP to get metric such as throughput. The SNMP provides raw data and MRTG consolidate and then represent the data as graph (so the raw data become more human readable). In the “Telegraf, Prometheus and Grafana” scenario, you can consider Telegraf doing the job of SNMP, while Prometheus and Grafana doing the job of MRTG.
The following block diagram shows how each components talk to each other (this is also the demo environment I am going to use in the step-by-step configuration):