Enable Telegraf on VCG
You can find the official guide here Monitor Gateways using Telegraf
The following is how I enable Telegraf on my demo environment.
Step 1: Add the user telegraf to sudo group
This is because Telegraf needs to run /opt/vc/bin/dispcnt command in /etc/telegraf/vcg_metrics.sh. The command to add user telegraf to sudo is
sudo usermod -G sudo telegraf
Sample screen capture from my demo environment:

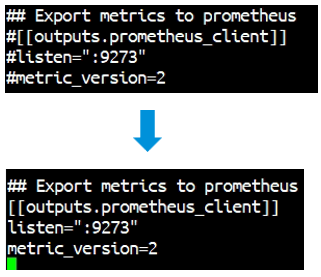
Step 2: Edit the /etc/telegraf/telegraf.conf
By default, telegraf.conf is not exporting any metric. To make Telegraf export the metric in Prometheus format, ucomment the three lines below “## Export metrics to prometheus”. The following screen capture shows the change being made in my demo environment:
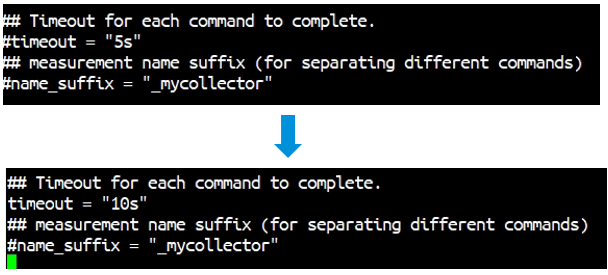
The timeout for each command to complete needs to configured as 10s. In later release, the timeout is already configured as 10s, if this is the case, no change is required. If the timeout is 5s, uncomment and change the timeout value to 10s. The following screen capture shows the change being made in my demo environment:
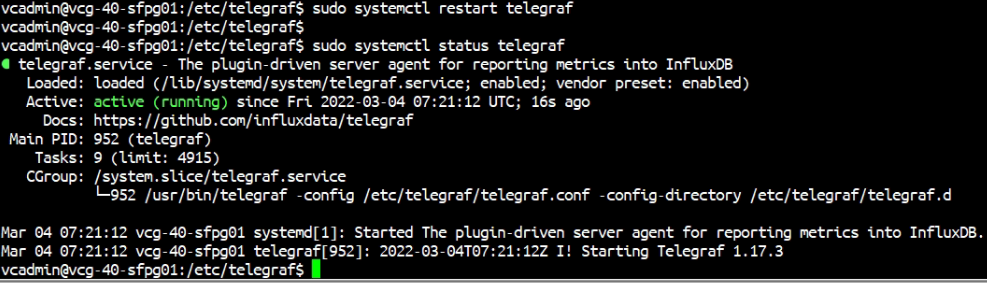
Step 3: Restart the Telegraf
After the configuration change in Telegraf, restart the Telegraf service to make the change effective. The command to restart the service is
sudo systemctl restart telegraf
To check status of the telegraf service:
sudo systemctl status telegraf
The following screen capture shows restart and checking the status of telegraf:
Step 4: Adjust the iptables
By default, Telegraf is listening on port 9273, waiting for the Prometheus client to visit. The VCG iptables by default block every source IP to access port 9273. Thus, the iptables rule need to modify to allow Prometheus client to connect to port 9273. The command is:
sudo iptables -I INPUT -p tcp -m tcp --source <Prometheus Client IP> --dport 9273 -m comment --comment "prometheus" -j ACCEPTIn my demo environment, the Prometheus machine IP address is 192.168.252.26, the following screen capture shows the corresponding iptables command:

*Reminder: The iptables rule will not persist after reboot. You can edit /etc/iptables/rules.v4 to include this new iptables rule to make the change survive after reboot (or use any other methods you can comfortable with)
Step 5: Verification of Telegraf
To verify if the Telegraf is working or not, at the Prometheus client, issue this curl command:
curl http://<VCG IP address>:9273/metrics
The example screen capture shows Prometheus client get metrics from a VCG with IP address 24.11.0.54:
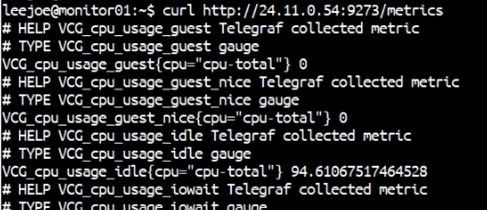
If everything is working, the curl will get response. And in the response there will are a list of metrics with prefix VCG_ like the above screen capture.
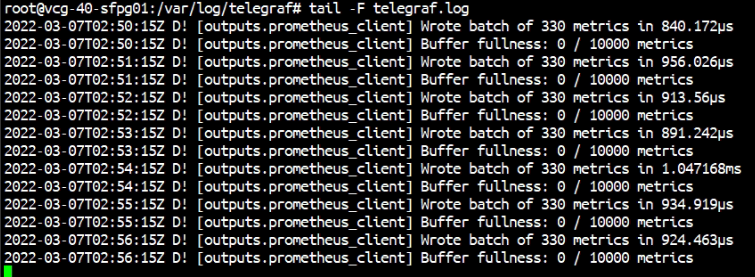
It is worth to mention the Telegraf log file is at /var/log/telegraf.conf. By looking into this log file, we notice the metrics are obtained every 60 seconds: