Installation of Prometheus and Grafana
The installation is not the focus of this article. Refer to the official web site for the installation instruction:
Installation of Prometheus: https://prometheus.io/docs/prometheus/latest/installation/
Installation of Grafana: https://grafana.com/docs/grafana/latest/installation/debian/
Configure and Verify Prometheus
Step 1: Add new job at Prometheus configuration file
My demo system is Ubuntu 20.04, the Prometheus configuration file is at /etc/prometheus/prometheus.yml
To make the Prometheus collect metrics from the Telegraf agent in VCG, edit the configuration file by adding new job. In this example, a new job called “SF-VCG1” where the VCG IP address is 24.11.0.54. To do this, append the text below to the end of the Prometheus configuration file:
- job_name: 'SF-VCG1'
  scrape_interval: 60s
  static_configs:
    - targets: ['24.11.0.54:9273']
If you need to monitor multiple VCGs, you can add multiple jobs.
Step 2: Restart Prometheus
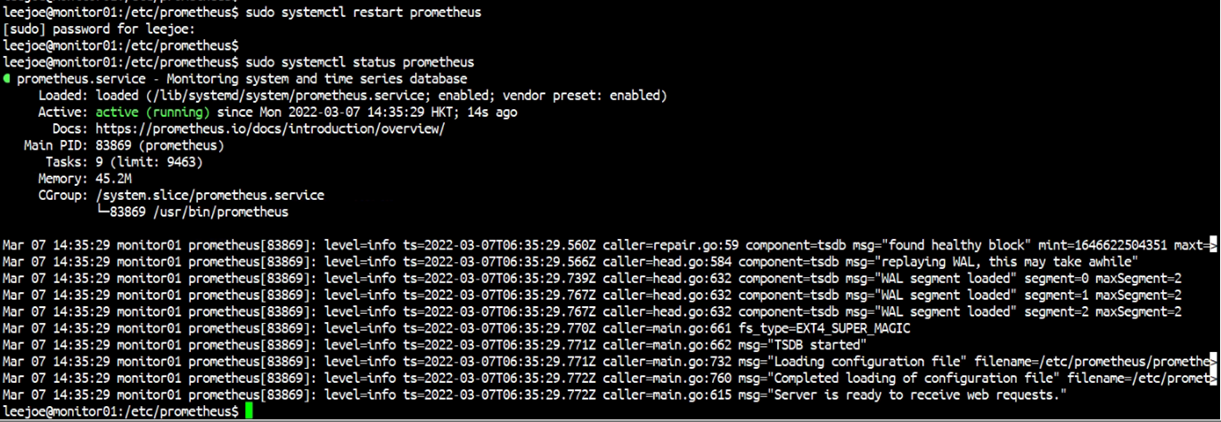
Prometheus needs to be restarted for the new configuration to take effect. To restart Prometheus:
sudo systemctl restart prometheus
To check the Prometheus status:
sudo systemctl status prometheus
Sample screen capture from my demo environment

Step 3: Verify the Prometheus is able to get metrics from Telegraf at VCG
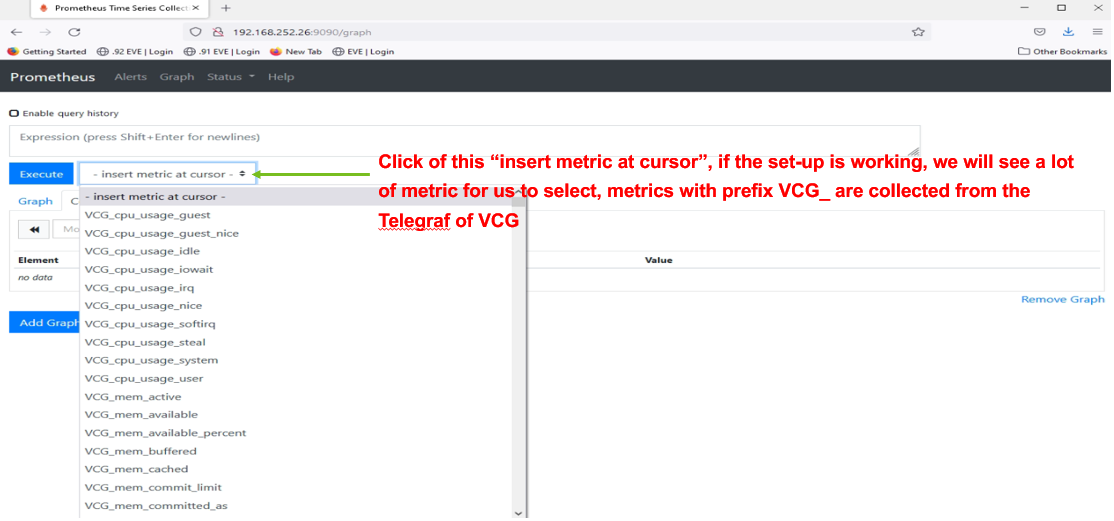
To verify is the setting is working or not, open a browser and then access port 9090 of the Prometheus. In my demo environment, I access http://192.168.252.26:9090:

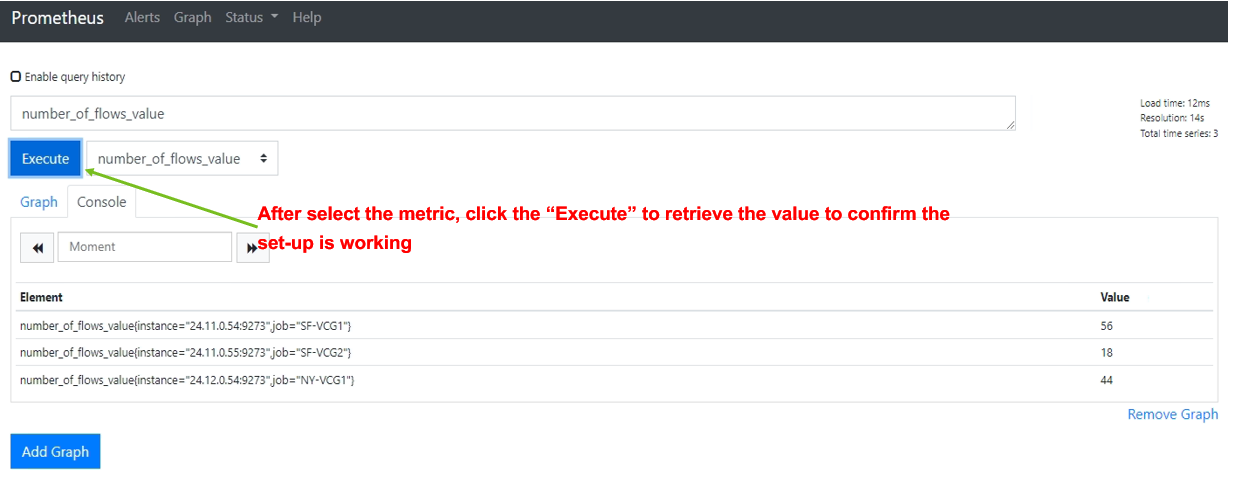
At the Prometheus web interface, click on the drop down menu “- insert metric at cursor -“, if there are metrics with prefix VCG_, the setup should be working. To confirm, pick one of those metrics and click “Execute” to check if the value is available or not. The following screen capture shows successfully query the value of the metric number_of_flows_value

This concludes the Prometheus is working properly.