About the sample Grafana dashboard for VCG
Before jumping to how to configure the Grafana, I would like to point out couple things about sample dashboard provided in this post (the json you download from the first page)
The supported counters is such a long list, I picked a few counters which I believe most people would like to have them available in the dashboard. The following are the counters included in the dashboard:
- mem_available (Memory available)
- Sum of all cpu_usage (Total CPU usage in percentage)
- num_paths_PATH_STABLE, num_paths_UNSTABLE, num_paths_QUIET, num_paths_INITIAL-
- number_of_edges
- active_NAT_entries
- number_of_flows
- number_of_routes
- tx_bytes and rx_bytes (Per Enterprise, represent as 5 minutes average throughout)
- tx_packets and rx_packets (Per Enterprise, represent as 5 minutes average packet rate)
If any counters you want but it is not in the dashboard, free feel to add them by yourself.
Secondly, the dashboard utilize variable to allow monitor multiple VCGs and each VCG is an individual job. At the top of the dashboard, there is an drop-down selection “Select VCG” to allow select one of the VCG in the Prometheus job list to read the corresponding metrics. If the panel is intended for “Per Enterprise”, there is another drop-down selection for you to select the corresponding Enterprise.
Finally, if you find anything is not correct in the dashboard, please either leave a comment or ping me via linkedin, I will try my best to fix the dashboard.
Configure Grafana
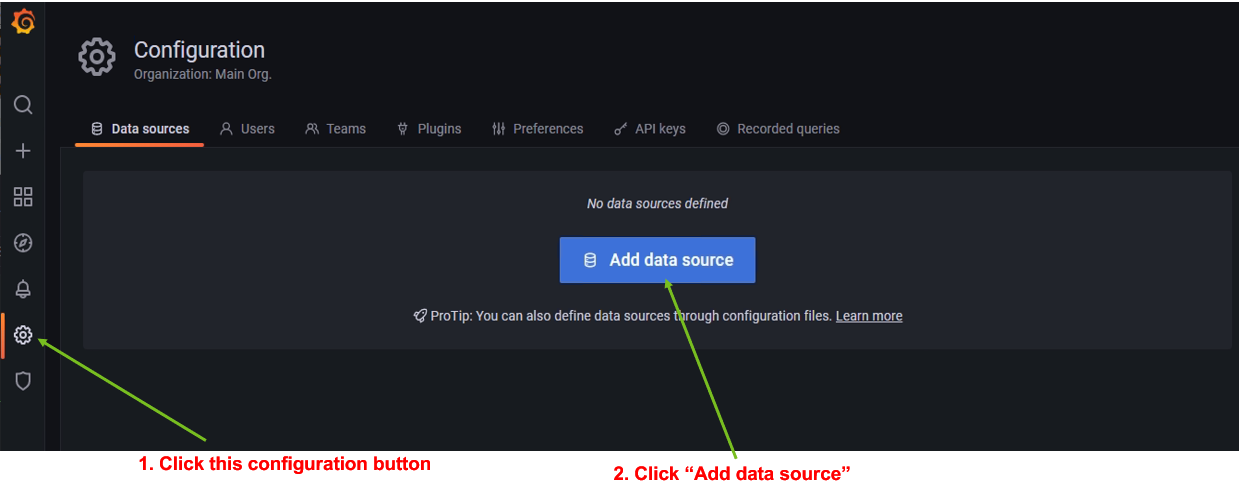
Step 1: Add data source
Open the browser, visit port 3000 of the Grafana to access the Grafana GUI.
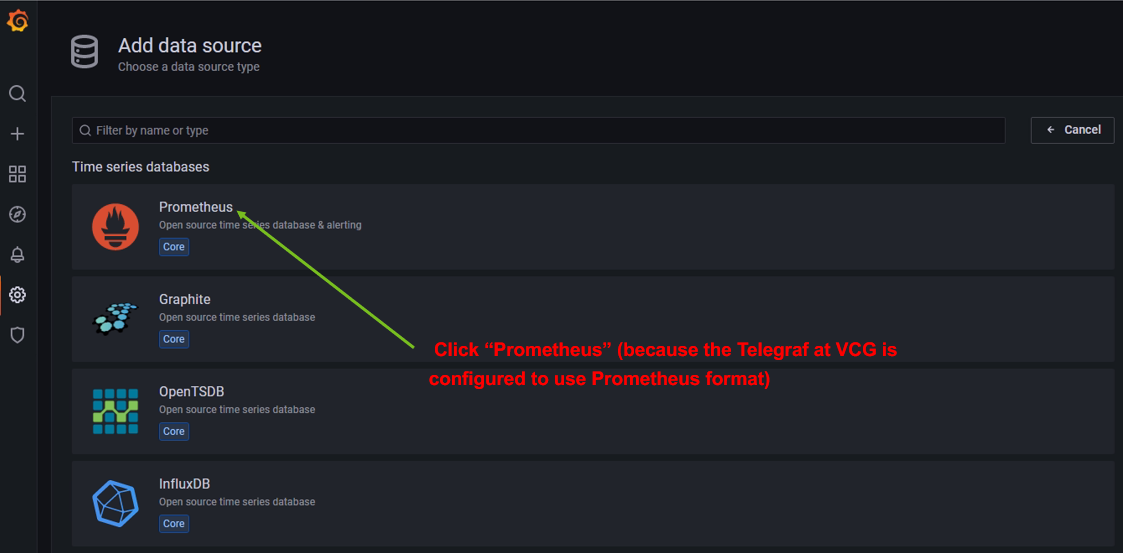
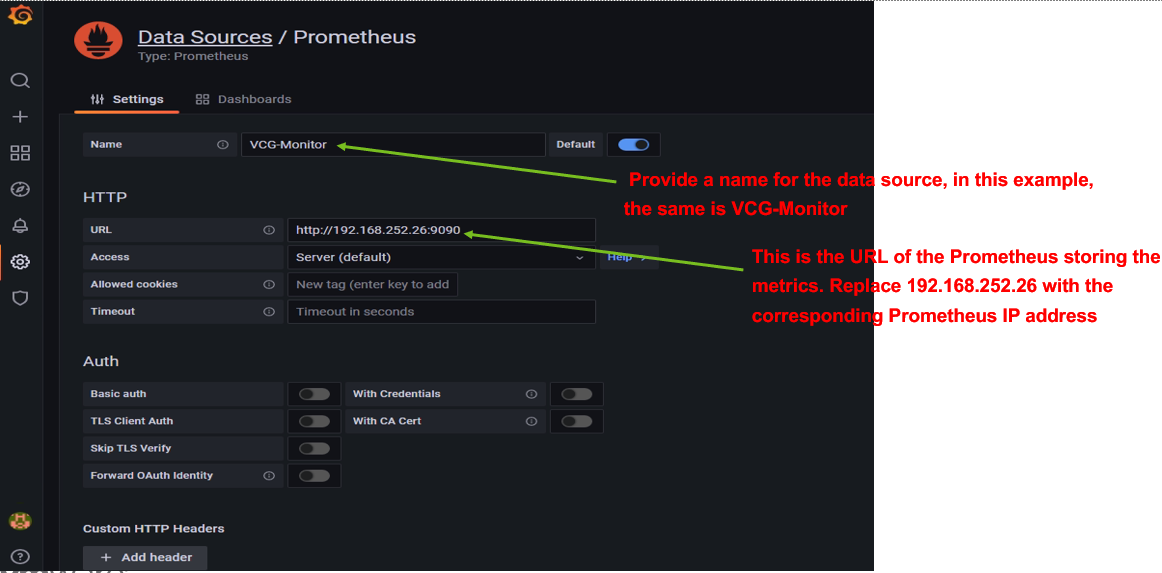
The following series of screen capture demonstrate how to add the Prometheus as the data source:
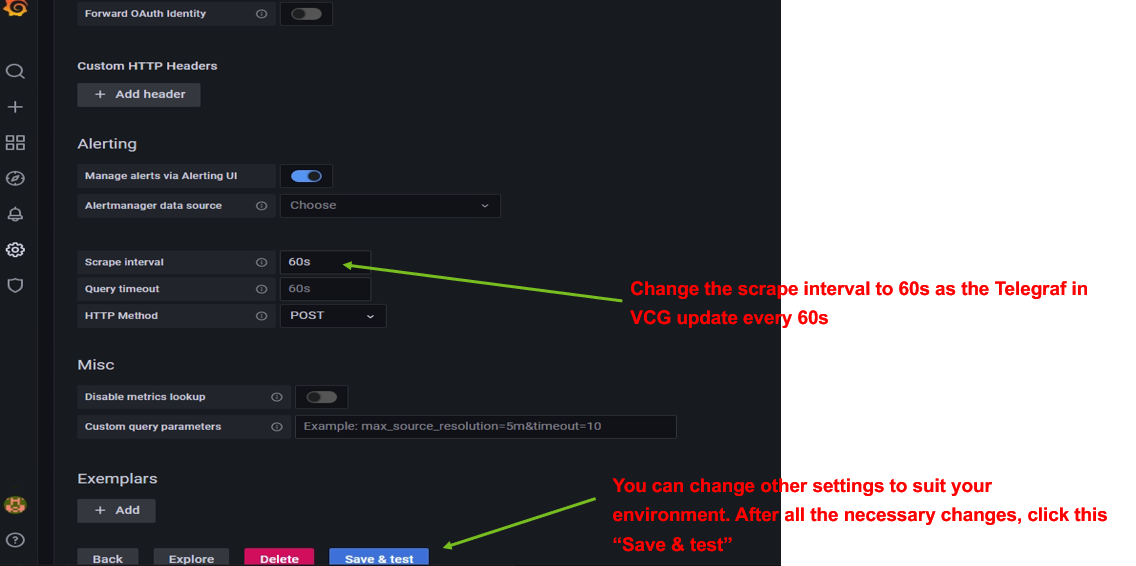
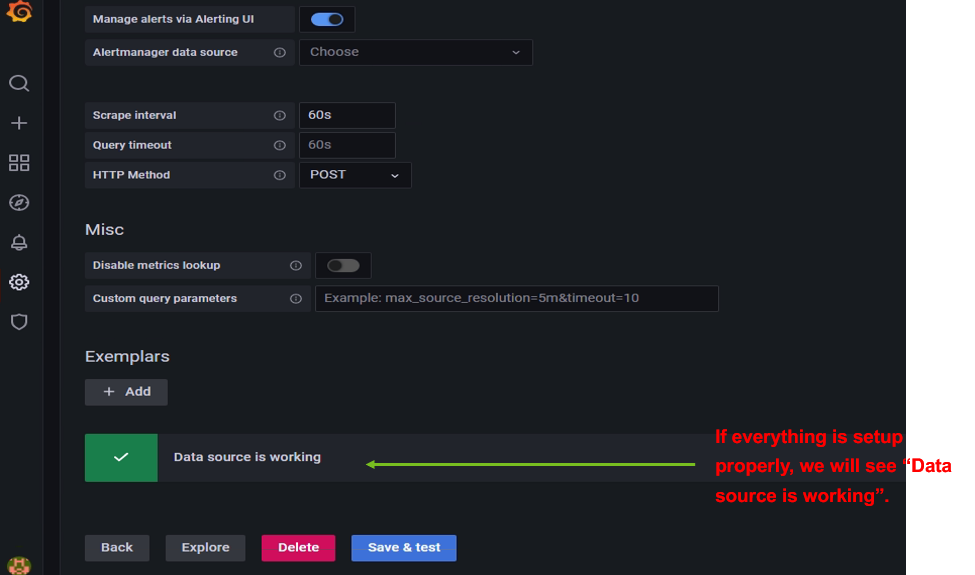
At this point the data source is added successfully
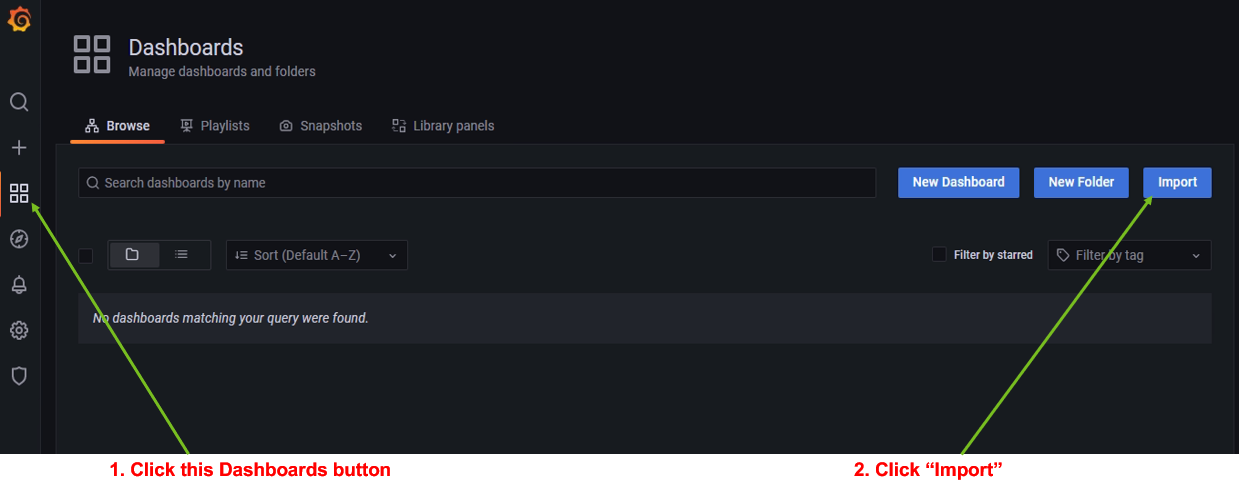
Step 2: Import the dashboard
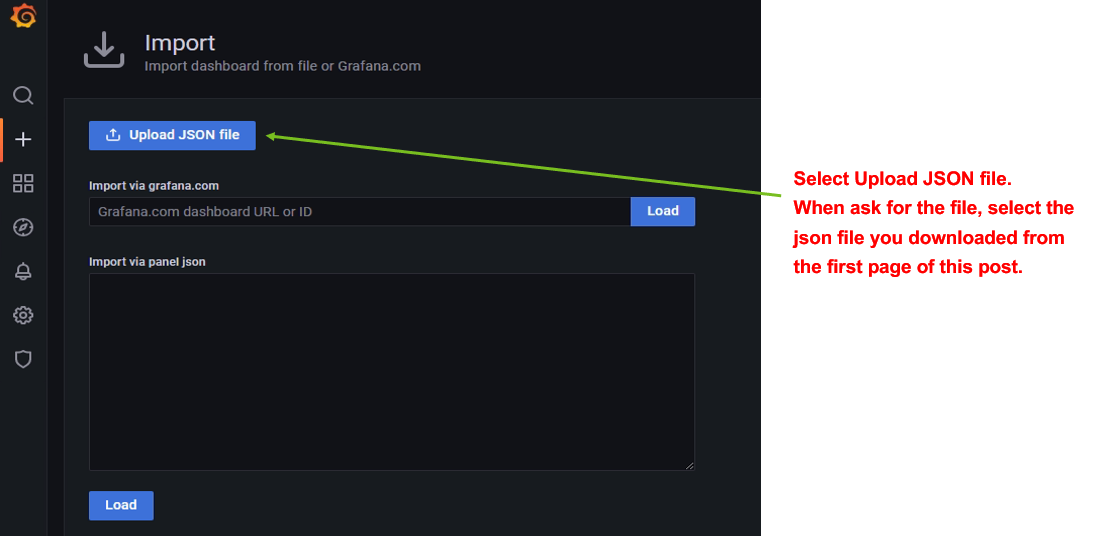
The following screen captures demonstrate how to import the dashboard:
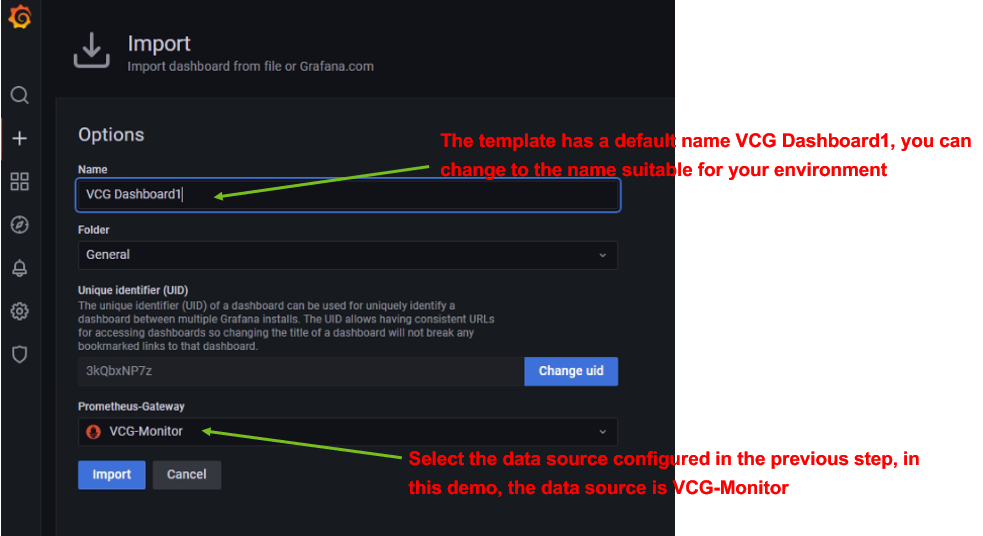
At this point, the import of the dashboard is completed, and the dashboard is ready.