SD-WAN

nevermind wind, no matter rain

Grafana Dashboard for SD-WAN Gateway (VCG)

The Dashboard and Panels

After the import of the dashboard, you should see a dashboard like the following (the dashboard is long, the screen capture only show the 3 graphs at the top).
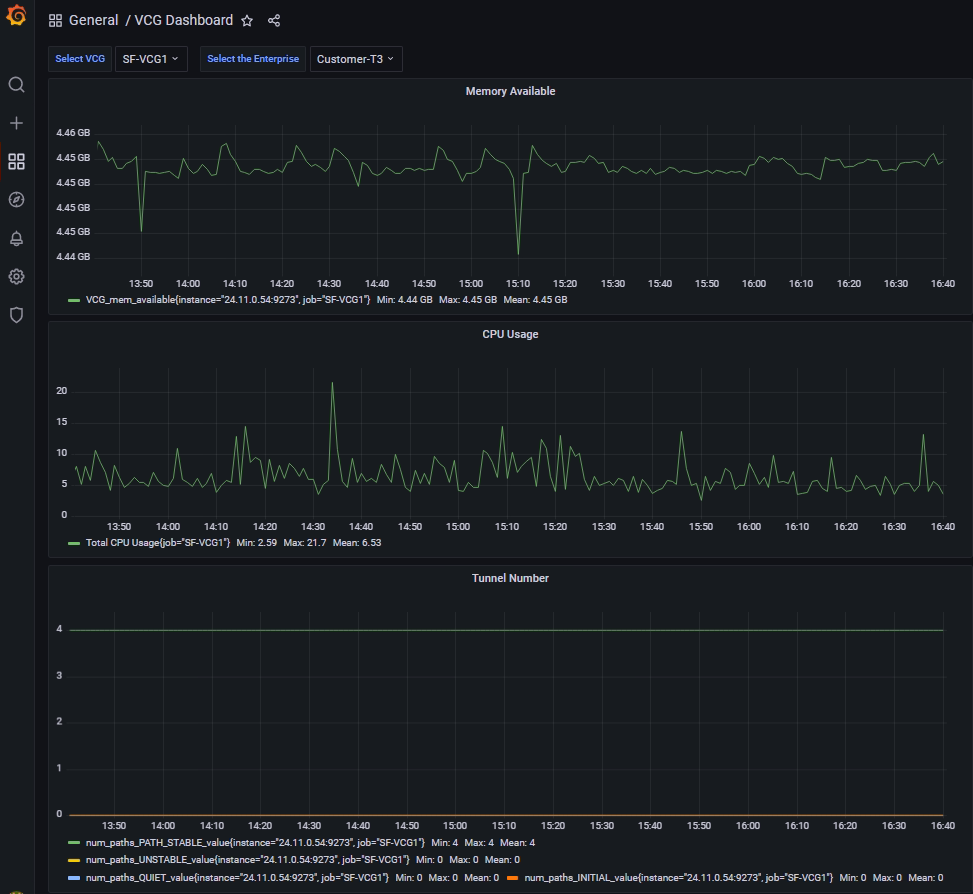
Figure 20 – How the dashboard looks like after import

Let’s have couple more samples of individual panel. The first one is the number of flows for a VCG called SF-VCG1
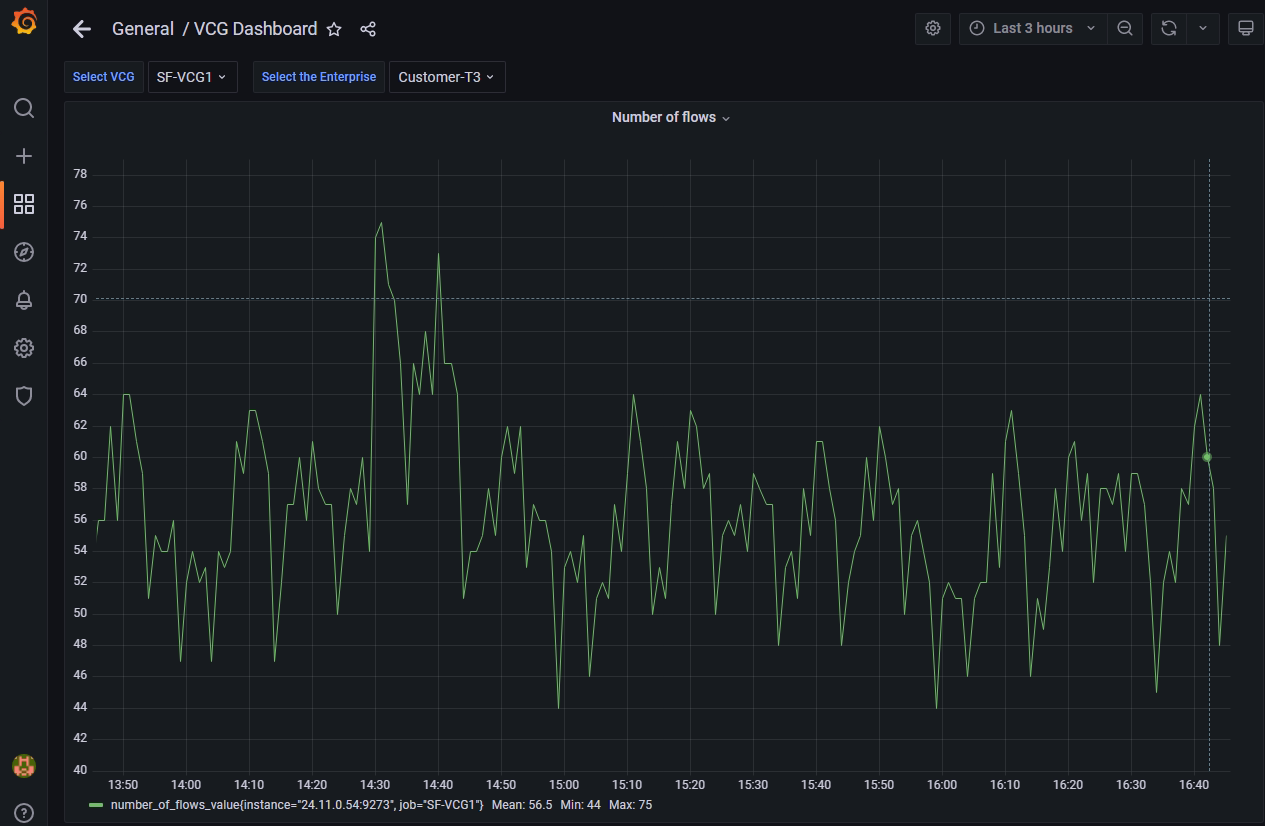
Figure 21 – Number of flows of VCG named SF-VCG1 (Last 3 hours)

The second one is average throughput of a particular Enterprise
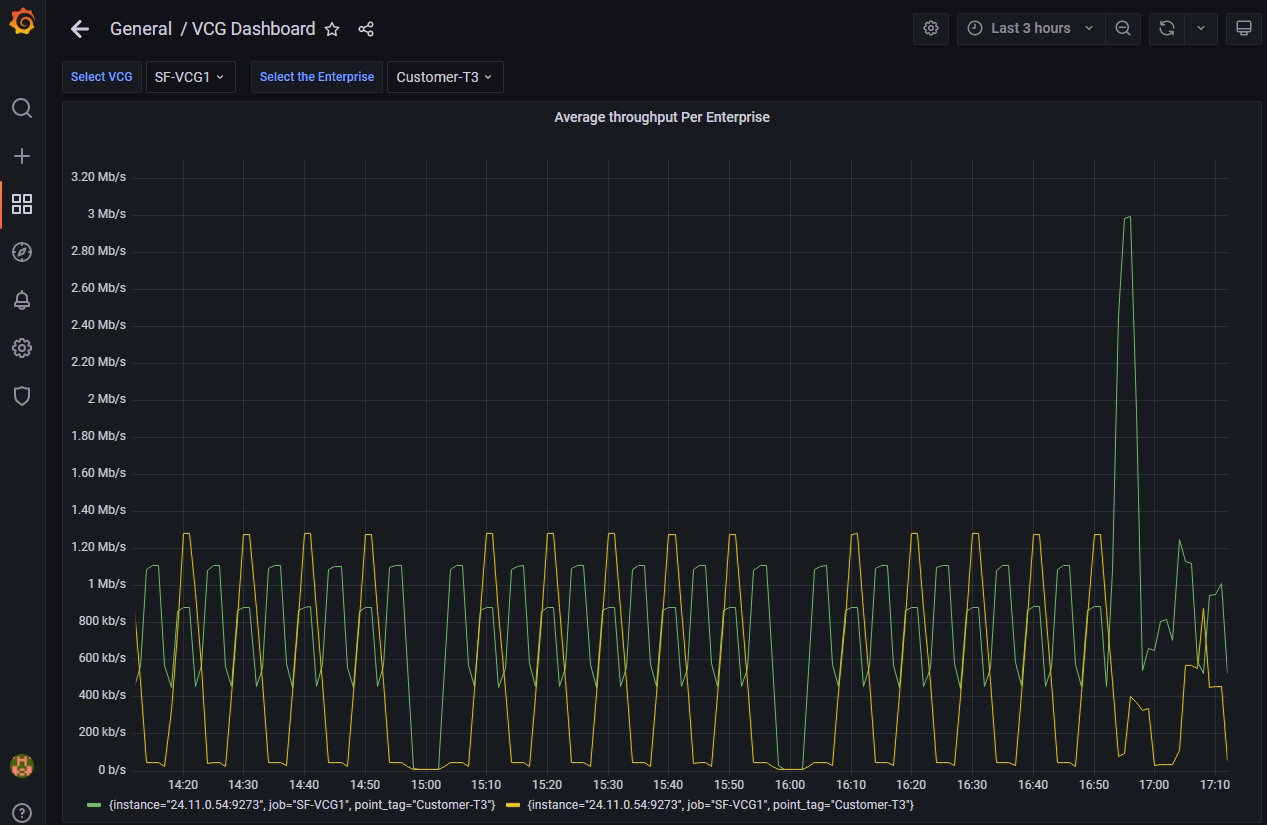
Figure 22 – Average throughput (per 5 mins) in VCG named SF-VCG1 for the Enterprise named Customer-T3 (Last 3 hours)

–THE END–

Grafana Dashboard for SD-WAN Gateway (VCG)

Leave a Reply

Your email address will not be published. Required fields are marked *

Scroll to top