Flow Visibility Tests
Test 1: iperf with a single data flow
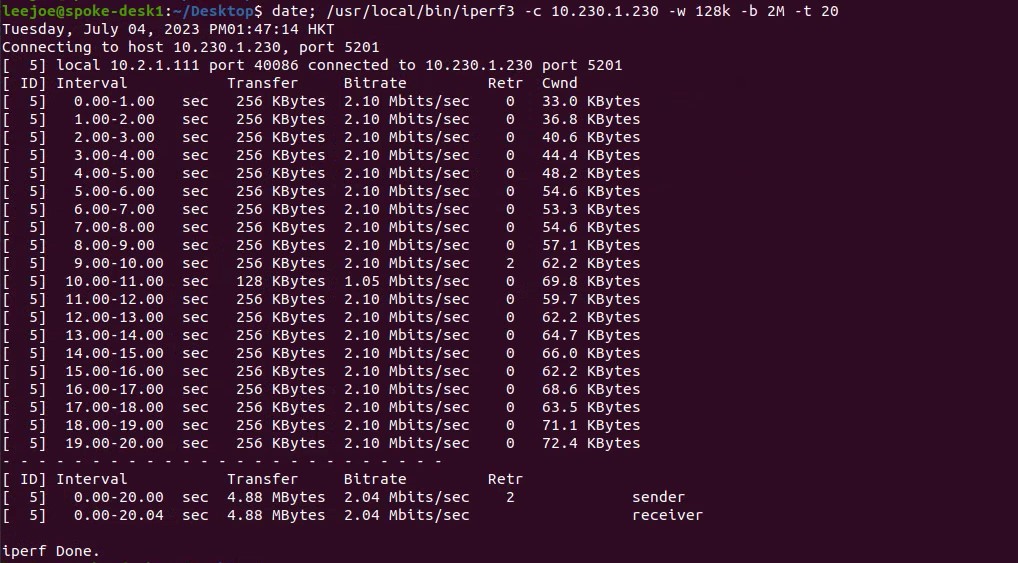
The iperf command being used is
/usr/local/bin/iperf3 -c 10.230.1.230 -w 128k -b 2M -t 20Screen capture of the iperf3 client output:
While the iperf3 is running, packet capture was done on the iperf client machine (10.2.1.111). The following is the conversation of the packet capture:
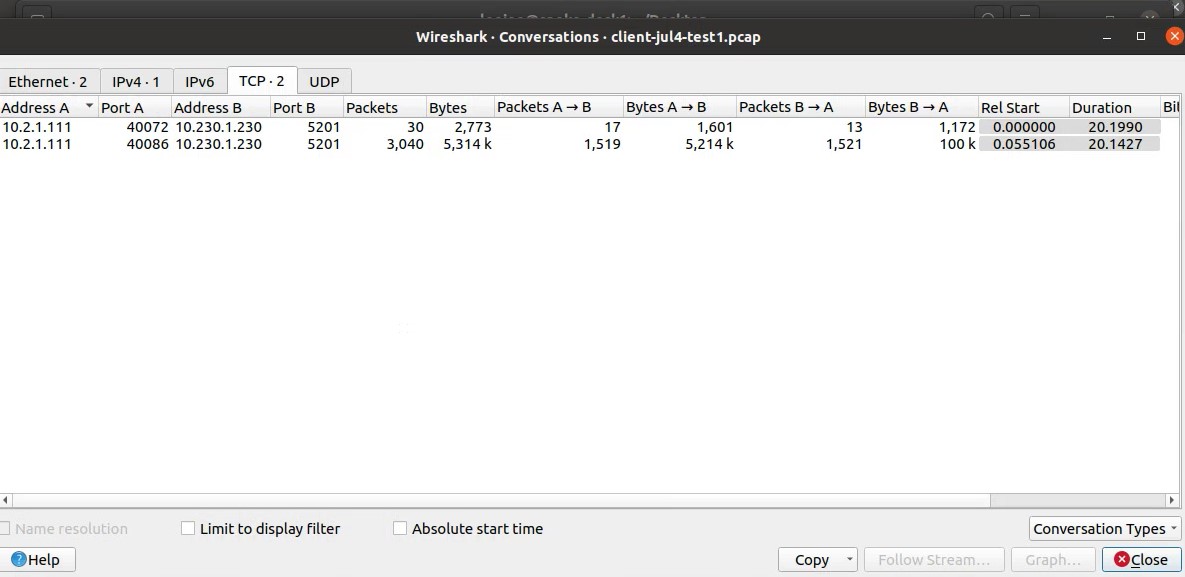
The packet capture shows us there are two TCP stream 10.2.1.111:40072 <–> 10.230.1.230:5201 and 10.2.1.111:40086 <–> 10.230.1.230:5201. The one with source port 40072 should be the iperf control connection while the data are being transmit at the one with source port 40086.
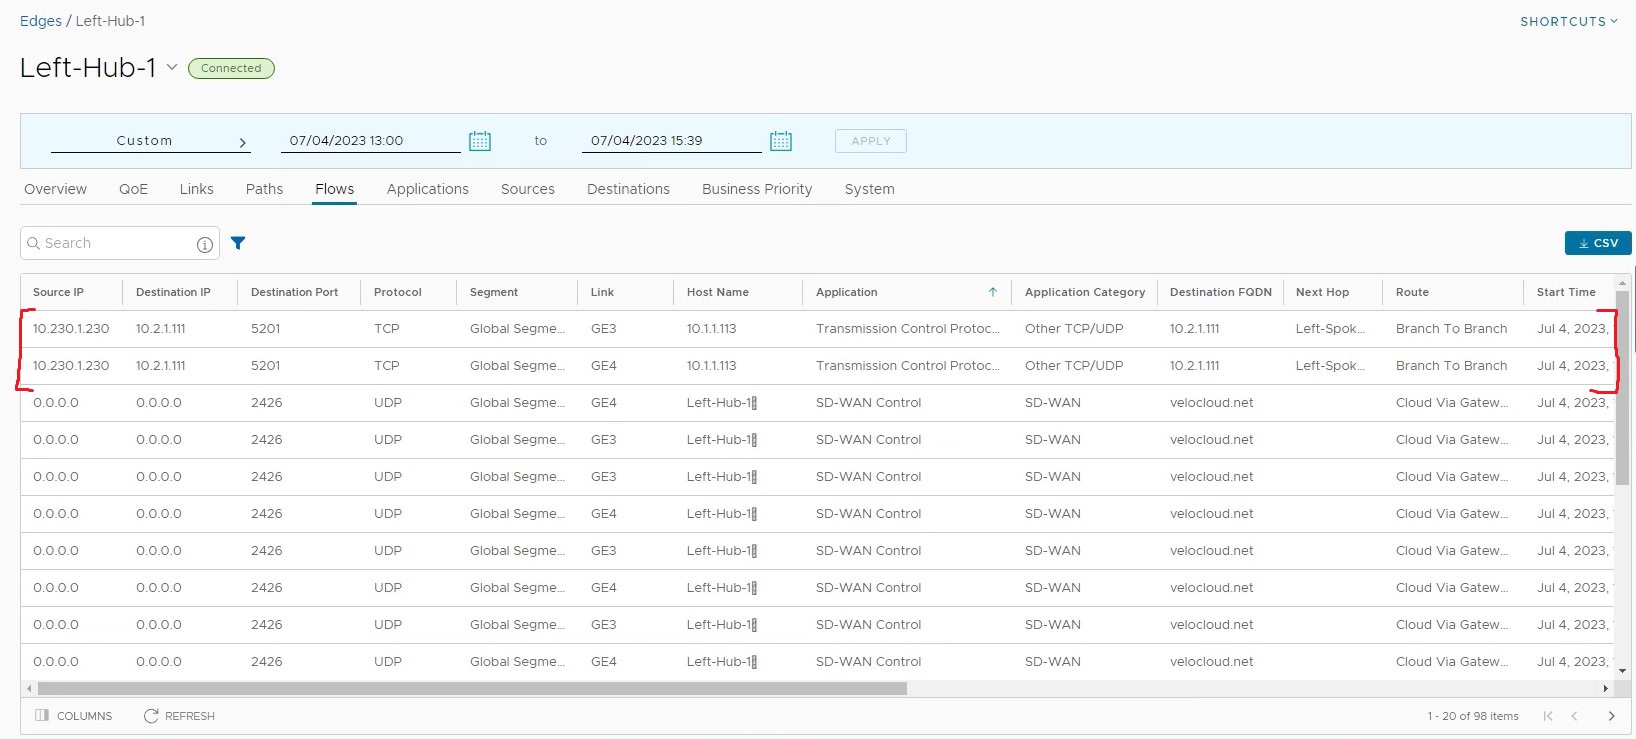
Now, let’s take a look of what this become in the “Flows” tab in the VCO:
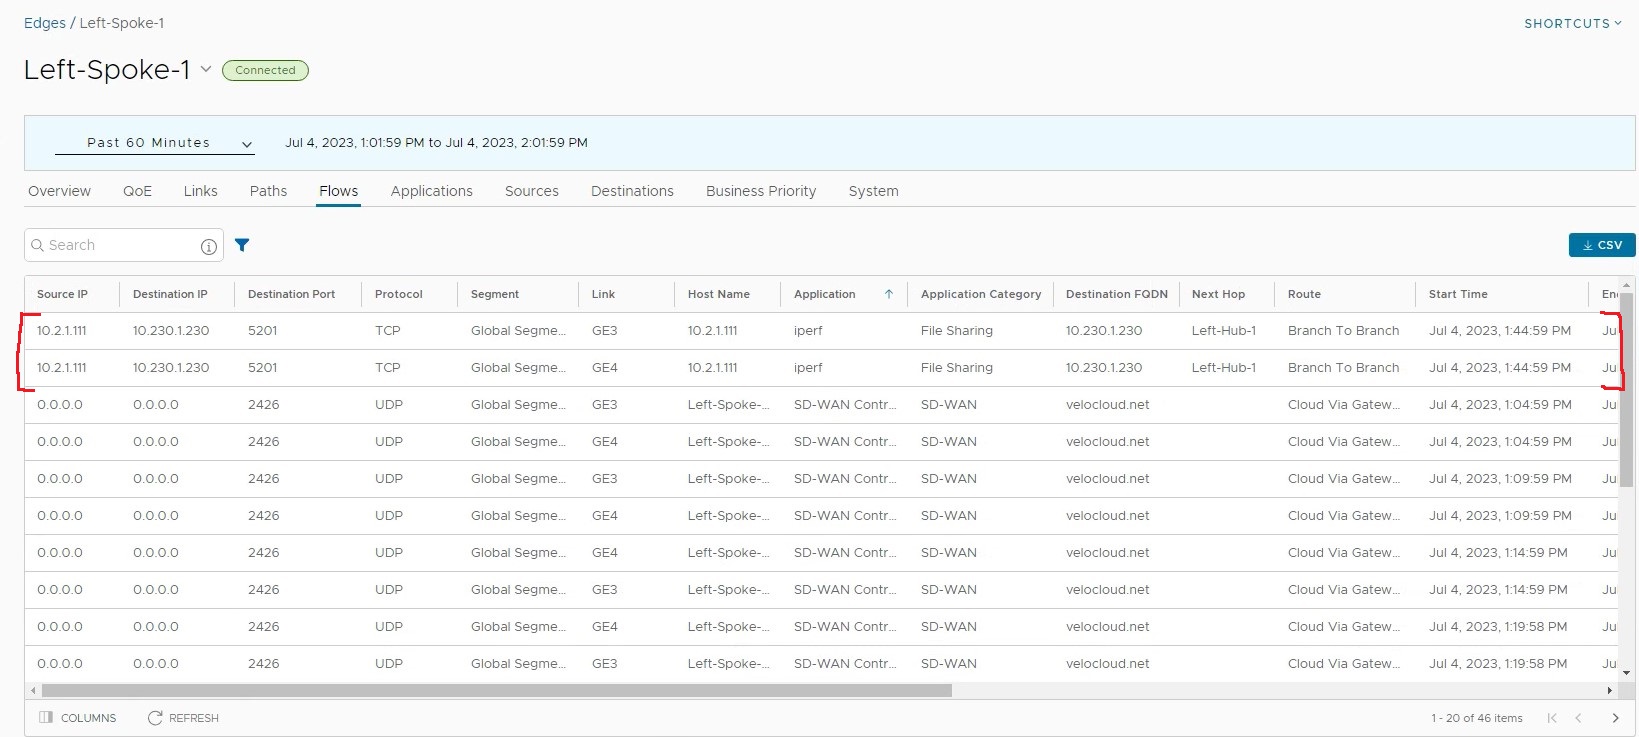
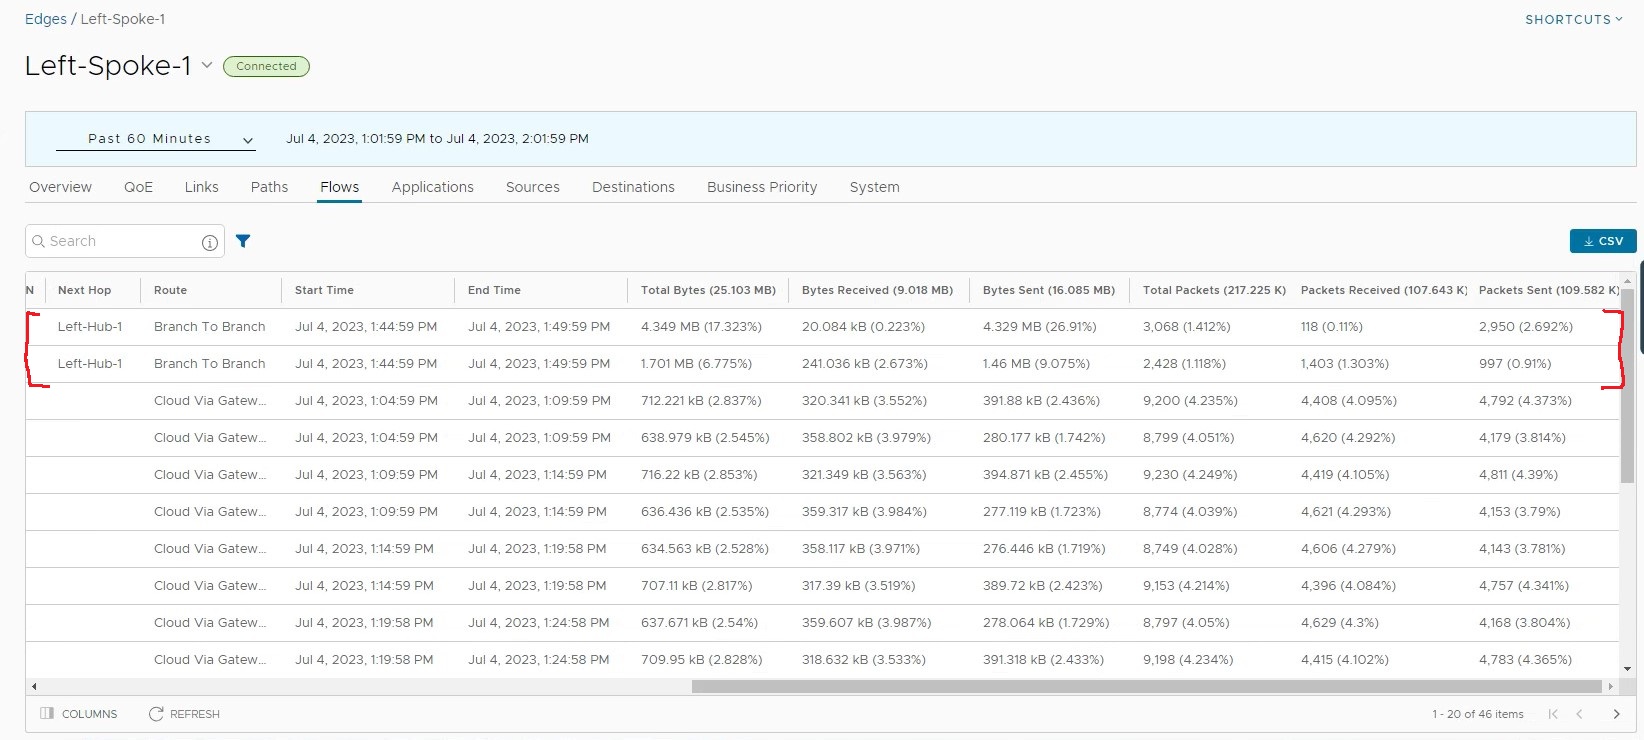
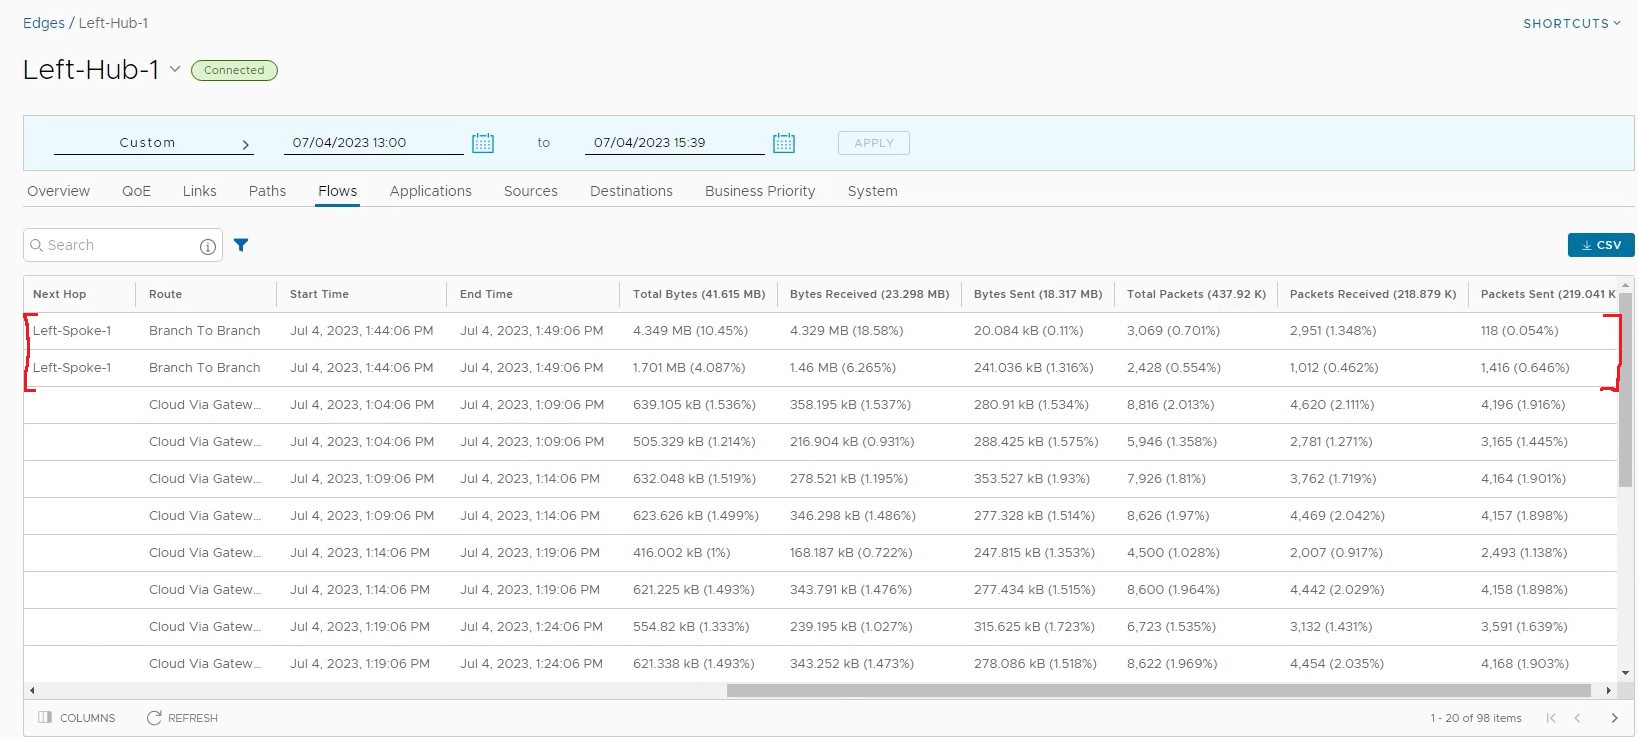
Firstly, because the flows contain a lot of information, the output is too width to display in a single screen capture, two screen captures are used to show the entire flow information. To make reading the flow easier, the related flow generate by the iperf test is marked with red square bracket (sorry for my bad drawing). There are a few things caught my attentions:
- There is no “source port” column.
- There are two row here and seems there are two rows because some traffic is using GE3 (Internet) and some traffic is using GE4 (MPLS).
- The duration of the flows are always a 5-minute interval, in this example is 1:44:59pm to 1:49:59pm, while the iperf ran only for 20 seconds.
- There is a next hop showing the next hop SD-WAN Edge which is Left-Hub-1. And there is a route type of “Branch To Branch”.
For the no “source port” column, it is by design. Actually this comes back to the release note mentioned “consolidated data for each traffic flow”, that is how information are consolidated? It is understandable if every flow are recorded in the VCO, that will consume a lot of disk space. That’s why some sort of consolidation is required. It looks like if multiple flows from the same source IP (even with different source port) and visiting the same destination IP and port, they are grouped in the same “flow entry”. In the next section, will carry a iperf with multiple flows to confirm.
Since the DMPO is per packet, it is possible to have the same flow utilizing multiple WAN (that is the link column). From this test, when the flow spread across multiple WAN, GE3 and GE4, the flow are showing separately. That is in the flow visibility, each WAN link needs to count individually to display the data.
Regarding the start and stop time, the iperf3 traffic actually happens between 1:47:14pm to 1:47:34pm. And the flows show in the VCO is between 1:44:59pm to 1:49:59pm. We can realize the flows are always with a 5 minute interval in the VCO. This aligns with the current monitoring of SD-WAN Edge, the statistic collection is with a granularity of 5 minutes. That means the flow visibility is not to record the start and stop of individual flow, it records down flows fall into the 5-minutes interval, consolidate them as long as source IP, destination IP, destination port are the same.
So far, we are looking at the “Flows” at the spoke site Left-Spoke-1, let’s take a look at the hub site Left-Hub-1:
I believe the first thing caught our attention is the destination port is 5201. The iperf3 server is 10.230.1.230 listening at port 5201. If the flow is talking about source IP 10.230.1.230 with destination IP 10.2.1.111, then technically the destination port is not 5201, the destination port should be 40072 and 40086 from the packet capture. So why the flow data is displayed like this in the hub site Left-Hub-1?
The flow does not indicate it is “LAN to WAN” or “WAN to LAN”. Or in VMware SD-WAN’s term, is the flow locally initiated or initiated by the peer. I think VMware needs to enhance the flow visibility to include this to make the flow information making more sense.
Let’s check the “list active flow” in the Left-Hub-1 remote diagnostic to check:
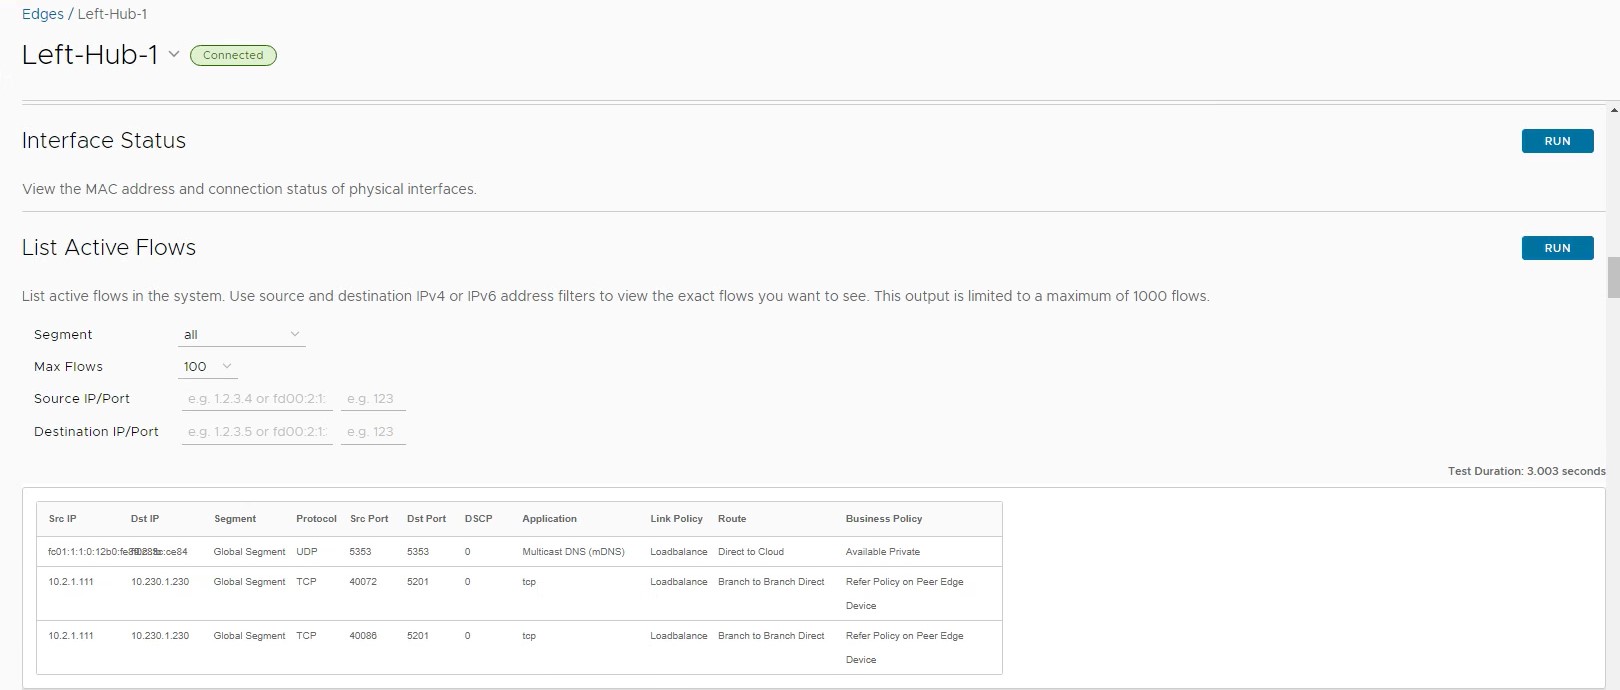
From List Active Flows at Left-Hub-1:
- Source IP: 10.2.1.111
- Source Port: 40072/40086
- Destination IP: 10.230.1.230
- Destination Port: 5201
From the “Flows” tab for Left-Hub-1 (flow visibility):
- Source IP: 10.230.1.230
- Source Port: N/A
- Destination IP: 10.2.1.111
- Destination Port: 5201
Here explain some of the confusions. In the VMware SD-WAN world, it is always the client side Edge, that is Left-Spoke-1 initiated the flow, and the server side Edge, that is Left-Hub-1, accept the flow. This is the reason when viewing the flow from Left-Hub-1, the business policy is “Refer Policy on Peer Edge Device”. That means the flow information is sort of “synchronize” from the Left-Spoke-1 to the Left-Hub-1, so this particular flow are with destination port 5201. And interestingly, the “Flows” tab (flow visibility) is always show “LAN to WAN” so it adjusted the source IP to 10.230.1.230 and destination IP to 10.2.1.111. Personally, this is quite confusing, I suggest VMware needs to at least add the flow is “locally initiated” or “peer initiated” in the “Flows” tab (flow visibility) to make the information more complete.